HOT TOPICS LIST
- MACD
- Fibonacci
- RSI
- Gann
- ADXR
- Stochastics
- Volume
- Triangles
- Futures
- Cycles
- Volatility
- ZIGZAG
- MESA
- Retracement
- Aroon
INDICATORS LIST
LIST OF TOPICS
PRINT THIS ARTICLE
by Gary Grosschadl
A somewhat mixed picture on the weekly chart makes this a hold or a guarded buy.
Position: Hold
Gary Grosschadl
Independent Canadian equities trader and technical analyst based in Peterborough
Ontario, Canada.
PRINT THIS ARTICLE
Vodaphone's (VOD) Chances
05/27/03 08:53:58 AMby Gary Grosschadl
A somewhat mixed picture on the weekly chart makes this a hold or a guarded buy.
Position: Hold
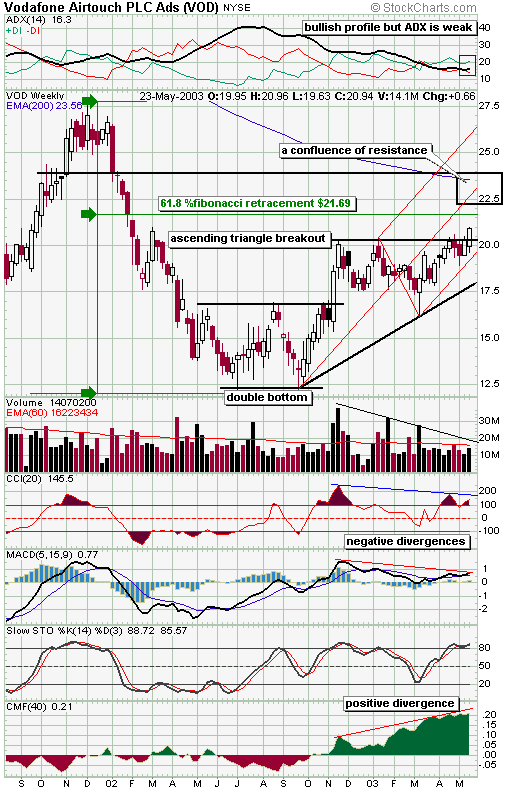
| Those aggressive traders that took a chance at the double bottom attempt from the $12.50 low were handsomely rewarded as Vodaphone (VOD) ran to $20. The more patient trader could have entered a long position just below $17 at the move from the trough. This was a high volume move that ran for two weeks before it ran out of steam at $20. Since then the stock consolidated sideways to form a bullish ascending triangle. |
| Now the stock has broken out of the pattern on higher volume but the volume is not exceptional compared to previous spikes. So this brings some doubt going forward: Does this breakout have enough conviction to carry much further? |

|
| VOD weekly chart. |
| Graphic provided by: Stockcharts.com. |
| |
| Besides the lack of volume conviction, some indicators hint at a possible lack of power going forward. The trend strength indicator at the top of the chart shows that despite the correct bullish profile of ADX-- between the DIs with +DI on top-- the ADX value is somewhat weak at 16.3. It will have to strengthen to above 20 to continue much higher. Also negative divergences are showing with CCI (commodity channel index), and the MACD (moving average convergence/divergence) is not matching higher values with price action. Stochastics are also at a high level so a danger of downturn below 80 exists. The CMF (Chaiken money flow) indicator however has a good bullish profile showing buying power accelerating towards the breakout move. Also note the red pitchfork lines (also called Andrews median line) show a bullish move between the tines. This alternate representation of support and resistance based on pivot points may indicate a move to the median (center) line. |
| The chart shows a possible early failure at a popular Fibonacci retracement level (61.8%) at $21.69. Should bullish strength prevail then the chart suggests a confluence of resistance from $22.50 - $24. This encompasses a zone pertaining to the median line, 200-period EMA, and a key candlestick resistance formation. Look for upside targets here and signs of possible reversal patterns. The daily chart should also be consulted for further clues. |
Independent Canadian equities trader and technical analyst based in Peterborough
Ontario, Canada.
| Website: | www.whatsonsale.ca/financial.html |
| E-mail address: | gwg7@sympatico.ca |
Click here for more information about our publications!
PRINT THIS ARTICLE

|

Request Information From Our Sponsors
- StockCharts.com, Inc.
- Candle Patterns
- Candlestick Charting Explained
- Intermarket Technical Analysis
- John Murphy on Chart Analysis
- John Murphy's Chart Pattern Recognition
- John Murphy's Market Message
- MurphyExplainsMarketAnalysis-Intermarket Analysis
- MurphyExplainsMarketAnalysis-Visual Analysis
- StockCharts.com
- Technical Analysis of the Financial Markets
- The Visual Investor
- VectorVest, Inc.
- Executive Premier Workshop
- One-Day Options Course
- OptionsPro
- Retirement Income Workshop
- Sure-Fire Trading Systems (VectorVest, Inc.)
- Trading as a Business Workshop
- VectorVest 7 EOD
- VectorVest 7 RealTime/IntraDay
- VectorVest AutoTester
- VectorVest Educational Services
- VectorVest OnLine
- VectorVest Options Analyzer
- VectorVest ProGraphics v6.0
- VectorVest ProTrader 7
- VectorVest RealTime Derby Tool
- VectorVest Simulator
- VectorVest Variator
- VectorVest Watchdog
