HOT TOPICS LIST
- MACD
- Fibonacci
- RSI
- Gann
- ADXR
- Stochastics
- Volume
- Triangles
- Futures
- Cycles
- Volatility
- ZIGZAG
- MESA
- Retracement
- Aroon
INDICATORS LIST
LIST OF TOPICS
PRINT THIS ARTICLE
by Gary Grosschadl
Two chart formations show heavy resistance at the 950 zone.
Position: N/A
Gary Grosschadl
Independent Canadian equities trader and technical analyst based in Peterborough
Ontario, Canada.
PRINT THIS ARTICLE
CHART ANALYSIS
S&P 500 Struggles With 950
05/27/03 10:28:03 AMby Gary Grosschadl
Two chart formations show heavy resistance at the 950 zone.
Position: N/A
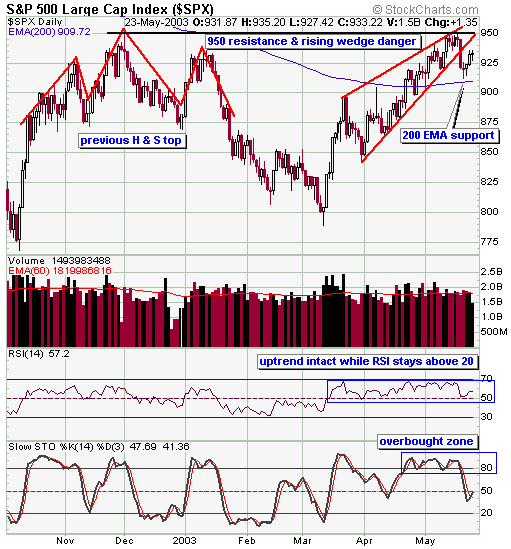
| The daily chart shows the SPX fighting a battle with the bearish implications of a rising wedge formation. It is no coincidence that the line in the sand is the 950 zone, this being the level of last December's head and shoulders top. It looked like the bearish intent of the rising wedge formation was fullfilling as the lower trendline was broken. However the 200-day EMA, often an important support level, came to the immediate rescue as the index held just a fraction above this level. One clue that support might come soon was that the volume on the day of the breakdown was not exceptional. Both the day before and the day after were at higher volumes suggesting that bearish conviction was not too heavy on the day of the trendline break. |
| Does this mean that the way is clear for a bullish drive past the 950 resistance zone? Not necessarily. With formations like triangles and wedges, it is not unusual for a move back up to test former resistance before a more serious bearish downleg resumes. This is likely to occur close to that same 950 level. |

|
| S&P 500 daily chart. |
| Graphic provided by: Stockcharts.com. |
| |
| Two indicators are worthy of mention here. The RSI or relative strength index shows good strength above the 50 level. The uptrend seems intact as long as the RSI 50 level is not breached. It also shows that the 70 level tends to show the upper resistance level. Watch for a move past either level as a tipoff to a significant event. The stochastics indicator shows another upleg developing, but a caveat here - it must move beyond the 50 level as this can be a stall point. This oscillator is also above 80, in overbought territory. The previous time this index hit this toppy zone it stayed there for an extended time. It's the move back down below 80 that is the crucial signal that the move has topped out. This can make the timing of a stochastic downturn somewhat tricky so other indicators should also be consulted in order to try for a consensus of opinion. |
| So another upside test is in store for this senior index. What happens there will likely be mirrored by the other indices. A move past the 950 zone that holds could be a very powerful signal for the bulls, but just as likely a downturn spells yet another downleg. This particular battle between the bulls and bears has yet to reach a climax. |
Independent Canadian equities trader and technical analyst based in Peterborough
Ontario, Canada.
| Website: | www.whatsonsale.ca/financial.html |
| E-mail address: | gwg7@sympatico.ca |
Click here for more information about our publications!
Comments
Date: 05/29/03Rank: 5Comment:
Date: 05/29/03Rank: 3Comment:

|

Request Information From Our Sponsors
- StockCharts.com, Inc.
- Candle Patterns
- Candlestick Charting Explained
- Intermarket Technical Analysis
- John Murphy on Chart Analysis
- John Murphy's Chart Pattern Recognition
- John Murphy's Market Message
- MurphyExplainsMarketAnalysis-Intermarket Analysis
- MurphyExplainsMarketAnalysis-Visual Analysis
- StockCharts.com
- Technical Analysis of the Financial Markets
- The Visual Investor
- VectorVest, Inc.
- Executive Premier Workshop
- One-Day Options Course
- OptionsPro
- Retirement Income Workshop
- Sure-Fire Trading Systems (VectorVest, Inc.)
- Trading as a Business Workshop
- VectorVest 7 EOD
- VectorVest 7 RealTime/IntraDay
- VectorVest AutoTester
- VectorVest Educational Services
- VectorVest OnLine
- VectorVest Options Analyzer
- VectorVest ProGraphics v6.0
- VectorVest ProTrader 7
- VectorVest RealTime Derby Tool
- VectorVest Simulator
- VectorVest Variator
- VectorVest Watchdog
