HOT TOPICS LIST
- MACD
- Fibonacci
- RSI
- Gann
- ADXR
- Stochastics
- Volume
- Triangles
- Futures
- Cycles
- Volatility
- ZIGZAG
- MESA
- Retracement
- Aroon
INDICATORS LIST
LIST OF TOPICS
PRINT THIS ARTICLE
by David Penn
The US Dollar index approaches a major test of lows set back in October 1998.
Position: N/A
David Penn
Technical Writer for Technical Analysis of STOCKS & COMMODITIES magazine, Working-Money.com, and Traders.com Advantage.
PRINT THIS ARTICLE
REVERSAL
The Greenback's 2B Test of Bottom
05/23/03 10:21:00 AMby David Penn
The US Dollar index approaches a major test of lows set back in October 1998.
Position: N/A
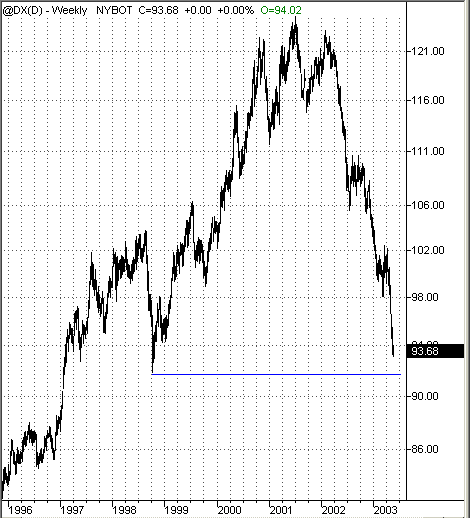
| Until the stock market revisits its October 2002 lows, the current contender for the title of "Mother of All Tests of Bottom" is undoubtedly the US Dollar Index. While still reflecting a historically reasonable valuation to the dollar (an observation I made in a Working-Money.com piece, "Down Goes the Dollar!" back in February), the US Dollar Index has nevertheless experienced a dramatic collapse from its highs of 2001. Once priced just north of 122, the US Dollar Index has fallen 22% to under 94 by the late spring of 2003. |
| Amid a general economic confusion that involves record high Federal deficits growing concurrently with record low interest rates, record monetary expansion with a lingering fear of deflation, and recently simultaneous rallies in gold, long-term Treasury bonds and common stocks, focus on the status of the greenback continues. Most recently, legendary financier and currency specialist George Soros made clear his bearishness on the dollar. The two-year bear market in the greenback did not respond particularly positively to the news. |

|
| A 2B test of bottom awaits a falling U.S. Dollar Index |
| Graphic provided by: TradeStation. |
| |
| But maybe the greenback should have taken some heart from the fact that-- deflation, reflation, inflation, no-flation-- everyone and their cousin seems to be betting against it. If nothing else, this extreme in sentiment against the dollar suggests that the possibility of a reversal-- even in the short-term-- is particularly high. The possibility of a reversal is bolstered additionally by the presence of major support at about 91.85, lows established back in October 1998 during the Russian debt and ruble crisis, and the related collapse (and bailout) of massive hedge fund Long-Term Capital Management. |
| One tool for analyzing and trading tests of bottom is the 2B test, about which I have frequently written for Traders.com. The 2B methodology was developed by Victor Sperandeo (of "Trader Vic" fame) and can be so powerful as to enable a trader to take a position virtually at the higher or low of a given price swing. In short, the 2B test of bottom suggests that when prices make a bottom, rally and then make a lower low than the previous bottom, any failure to follow-through to the downside in a relatively short period of time is an indication a reversal may be developing. |
| The longer the amount of time between the two bottoms, the longer a trader or analyst will need to wait to see whether or not "follow-through" actually develops. Sperandeo notes in his book, Methods of a Wall Street Master that "at major market turning points, long-term 2B's, the new high or low will usually break within seven to ten days." Given the time between the first low (October 1998) and the likely test of that low (summer 2003), we appear to be headed swiftly toward what potentially could be a "major market turning point" in the greenback. |
Technical Writer for Technical Analysis of STOCKS & COMMODITIES magazine, Working-Money.com, and Traders.com Advantage.
| Title: | Technical Writer |
| Company: | Technical Analysis, Inc. |
| Address: | 4757 California Avenue SW |
| Seattle, WA 98116 | |
| Phone # for sales: | 206 938 0570 |
| Fax: | 206 938 1307 |
| Website: | www.Traders.com |
| E-mail address: | DPenn@traders.com |
Traders' Resource Links | |
| Charting the Stock Market: The Wyckoff Method -- Books | |
| Working-Money.com -- Online Trading Services | |
| Traders.com Advantage -- Online Trading Services | |
| Technical Analysis of Stocks & Commodities -- Publications and Newsletters | |
| Working Money, at Working-Money.com -- Publications and Newsletters | |
| Traders.com Advantage -- Publications and Newsletters | |
| Professional Traders Starter Kit -- Software | |
Click here for more information about our publications!
Comments
Date: 05/27/03Rank: 5Comment:
Date: 05/29/03Rank: 5Comment:

Request Information From Our Sponsors
- StockCharts.com, Inc.
- Candle Patterns
- Candlestick Charting Explained
- Intermarket Technical Analysis
- John Murphy on Chart Analysis
- John Murphy's Chart Pattern Recognition
- John Murphy's Market Message
- MurphyExplainsMarketAnalysis-Intermarket Analysis
- MurphyExplainsMarketAnalysis-Visual Analysis
- StockCharts.com
- Technical Analysis of the Financial Markets
- The Visual Investor
- VectorVest, Inc.
- Executive Premier Workshop
- One-Day Options Course
- OptionsPro
- Retirement Income Workshop
- Sure-Fire Trading Systems (VectorVest, Inc.)
- Trading as a Business Workshop
- VectorVest 7 EOD
- VectorVest 7 RealTime/IntraDay
- VectorVest AutoTester
- VectorVest Educational Services
- VectorVest OnLine
- VectorVest Options Analyzer
- VectorVest ProGraphics v6.0
- VectorVest ProTrader 7
- VectorVest RealTime Derby Tool
- VectorVest Simulator
- VectorVest Variator
- VectorVest Watchdog
