HOT TOPICS LIST
- MACD
- Fibonacci
- RSI
- Gann
- ADXR
- Stochastics
- Volume
- Triangles
- Futures
- Cycles
- Volatility
- ZIGZAG
- MESA
- Retracement
- Aroon
INDICATORS LIST
LIST OF TOPICS
PRINT THIS ARTICLE
by Koos van der Merwe
The US$ is falling like a stone. The Gold price is going through the roof. Alan Greenspan appears on CNBC and tells everyone in a language few can understand, that the US economy will be fine. The Dow, S&P500 and Nasdaq move sideways...
Position: N/A
Koos van der Merwe
Has been a technical analyst since 1969, and has worked as a futures and options trader with First Financial Futures in Johannesburg, South Africa.
PRINT THIS ARTICLE
VOLATILITY
A Confluence of Uncertainty and Volatility
05/23/03 10:18:52 AMby Koos van der Merwe
The US$ is falling like a stone. The Gold price is going through the roof. Alan Greenspan appears on CNBC and tells everyone in a language few can understand, that the US economy will be fine. The Dow, S&P500 and Nasdaq move sideways...
Position: N/A
| The $64,000 question on every investor's lips as they run for the cover of cash, leaving the market to speculators and gamblers, is when will investments return to normal? Ever since the bursting of the bubble in March 2000, and 911 terrorist attack in the same year, the world has become a different place to live in - different that is from the previous 10, 20 even 30 years depending on your level of risk. You can ask in all sincerity, can charts fortell the future of the market based on past events, or is the uncertainty here to stay? |
| In my article "Predicting the Future Using Elliott Wave Analysis," Traders.com Advantage, 10/07/02, I concluded that the next few years are going to be extremely volatile, that many investors will stay away from the market but gradually be sucked back into it as they remember the hype of 2000, and sometime between 2004 and 2006, the start of a major crash will occur, with Wave 2 of Wave C probably forming a double top and another opportunity to exit the market. In my article "The Nasdaq, Elliott Wave and Kondratieff," Traders.com Advantage, 11/19/02, I concluded that I am inclined to accept Elliott above Krondatieff, I believe that the market is in a B-Wave up as outlined in the Nasdaq chart, and that the market, for the next few years, may move between years of hard times and years of good times. Years of panic (a bubble) could only occur again in the year 2023. So for the next few years enjoy the market. Krondatieff is saying "go for it," and the Nasdaq seems to be agreeing with this prediciton but suggesting you use caution along the way. These two articles were written before the Iraqi war, before the SARS scare, and before the collapse of the US$ and the rise of gold. Both articles suggest that, although the trend may be upward for the next two to four years, it will be very volatile as B-Waves usually are. |

|
| Figure 1: The Dow Jones |
| Graphic provided by: AdvancedGET. |
| |
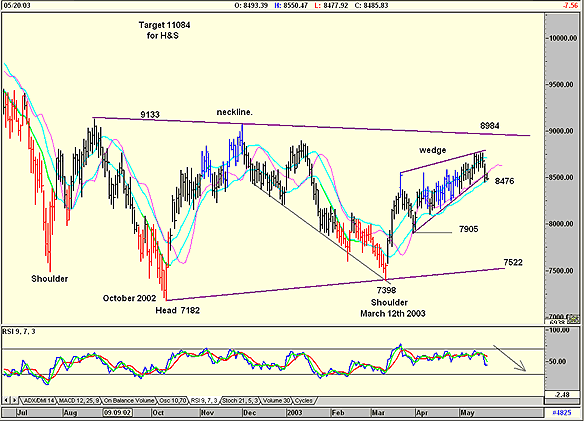
The above chart of the Dow shows what has happened since October 2002. You can see the extreme volatility, with October possibly forming the head of an inverted head and shoulder formation. If this is confirmed, then a break above the neckline should see the Dow test 11084 (9133 - 7182 = 1951 + 9133 = 11084). The Dow fell into the right shoulder, bottoming at 7398 on March 12th, 2003, and rose rapidly with a divergence buy signal given by the RSI indicator. All signs suggested that it should rise and test the neckline, then break it on its way to the target, but then as though remembering that any rise would have to be with extreme volatility, the Dow formed a rising wedge pattern. Rising wedge patters are bearish, which means that a fall to test the support level of 7905 and even the main support line at 7522 are very real. As shown, the RSI indicator looks extremely negative.  Figure 2: S&P 100. |
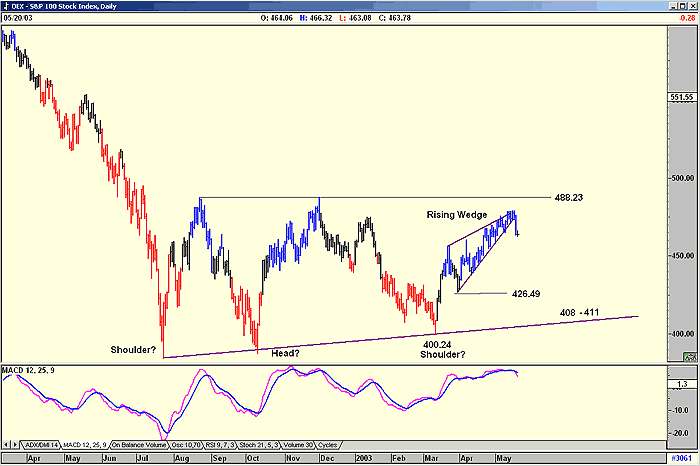
How does a chart of the S&P100 fare? The inverse head and shoulder pattern is not as obvious, but the same rising wedge and the breakdown from that wedge are. Even more disconcerting is that the entire larger pattern could be a triangle, meaning that the S&P, should it fall below the 408 - 411 level on the support line, could fall to zero, which is highly unlikely. The MACD indicator however, has broken downwards, so a test of the 426 and even the 408-411 level is possible. Figure 3: Nasdaq. |
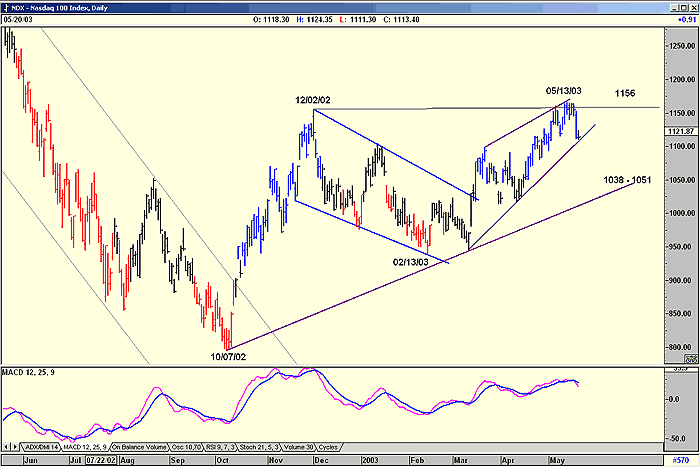
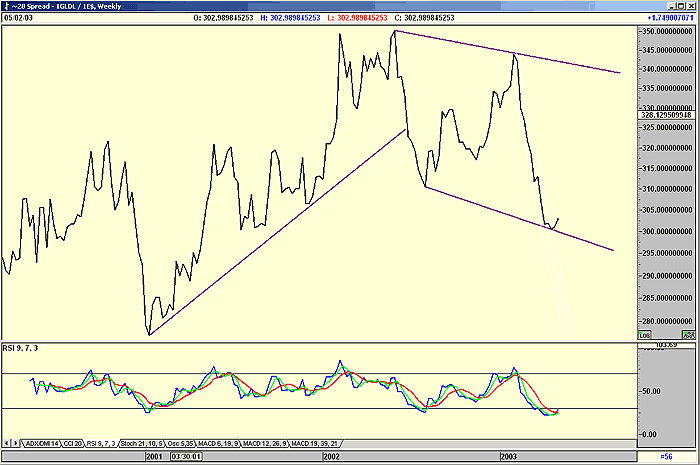
Then there is the Nasdaq, which broke out of a pennant formation, looking very strong. But it tested and couldn't effectively penetrate the 1156 resistance level. Once again the rising wedge has formed, but the Nasdaq hasn't broken it to give a sell signal although the MACD indicator suggests it will. Should it do so, its target could be the 1038 - 1051 level. Figure 4: Weekly chart of Gold/Euro. Finally, the US$. The weakness in the US$ is one of the ways to strengthen the US economy by making US produced products more competitive on world markets. Obviously it is not a very popular strategy with other countries, as they themselves are fighting recession and are not happy to see their products become more expensive in the US. Naturally they will strive to stop the strength of their currencies against the US$ and a levelling off should be in the cards in the near future. At the moment the rise in the gold price is a reflection of the weakness in the dollar. This can be seen in gold's price in euros. Gold's price in euros actually fell, while the gold price in dollars rose. The RSI indicator is suggesting strength, meaning the euro should start weakening and the US$ strengthening over the next few weeks. Is this a chart that can forecast the movement of either currency? Possibly, but the next few weeks will tell. This is another taste of uncertainty and volatility. Then of course, a falling gold price quoted in US$ means the Dow could start strengthening - or does it? A strong US$ will slow the US recovery. The volatility and uncertainty of the market is present in the above indices. Yes, they will turn up, and yes the market is bullish, but as I have said in my previous two long-term predictions, the market is in a B-Wave upwards, which means there will be plenty of uncertainty and volatility in the years ahead. |
Has been a technical analyst since 1969, and has worked as a futures and options trader with First Financial Futures in Johannesburg, South Africa.
| Address: | 3256 West 24th Ave |
| Vancouver, BC | |
| Phone # for sales: | 6042634214 |
| E-mail address: | petroosp@gmail.com |
Click here for more information about our publications!
Comments
Date: 05/27/03Rank: 3Comment:
Date: 05/27/03Rank: 4Comment:

|

Request Information From Our Sponsors
- StockCharts.com, Inc.
- Candle Patterns
- Candlestick Charting Explained
- Intermarket Technical Analysis
- John Murphy on Chart Analysis
- John Murphy's Chart Pattern Recognition
- John Murphy's Market Message
- MurphyExplainsMarketAnalysis-Intermarket Analysis
- MurphyExplainsMarketAnalysis-Visual Analysis
- StockCharts.com
- Technical Analysis of the Financial Markets
- The Visual Investor
- VectorVest, Inc.
- Executive Premier Workshop
- One-Day Options Course
- OptionsPro
- Retirement Income Workshop
- Sure-Fire Trading Systems (VectorVest, Inc.)
- Trading as a Business Workshop
- VectorVest 7 EOD
- VectorVest 7 RealTime/IntraDay
- VectorVest AutoTester
- VectorVest Educational Services
- VectorVest OnLine
- VectorVest Options Analyzer
- VectorVest ProGraphics v6.0
- VectorVest ProTrader 7
- VectorVest RealTime Derby Tool
- VectorVest Simulator
- VectorVest Variator
- VectorVest Watchdog
