HOT TOPICS LIST
- MACD
- Fibonacci
- RSI
- Gann
- ADXR
- Stochastics
- Volume
- Triangles
- Futures
- Cycles
- Volatility
- ZIGZAG
- MESA
- Retracement
- Aroon
INDICATORS LIST
LIST OF TOPICS
PRINT THIS ARTICLE
by David Penn
A symmetrical triangle pointed to a key breakdown in a 10-year Treasury note yields.
Position: N/A
David Penn
Technical Writer for Technical Analysis of STOCKS & COMMODITIES magazine, Working-Money.com, and Traders.com Advantage.
PRINT THIS ARTICLE
TRIANGLES
Treasury Triangles and Consolidations
05/22/03 09:06:45 AMby David Penn
A symmetrical triangle pointed to a key breakdown in a 10-year Treasury note yields.
Position: N/A
| CBS Marketwatch recently reported that the North Korean government is issuing 10-year bonds that have no coupon but will repay buyers with an "expression of affection" from the government of the People's Democratic Republic. In addition to the "expression of affection," those holding what the regime calls "The People's Life Bonds" will participate in a lottery, the winner of which will be entitled to an interest payment when their portfolio of People's Life Bonds matures. |
| I've got nothing against a good poke at the paleo-Stalinist regime of Kim Jong II. But I also can't help but note that US 10-year Treasury notes aren't stuffing any mattresses with lucre these days, either- with the 10-year Treasury index ($TNX) notching recent lows of 3.34%, before inflation. Given current inflation of 3.1%, that means a real yield more in the neighborhood of 0.24%. To my knowledge, there has been no word from Treasury Secretary Snow as to whether or not "the lottery option" will exist for those who hold 0.24% coupon T-notes until maturity. |

|
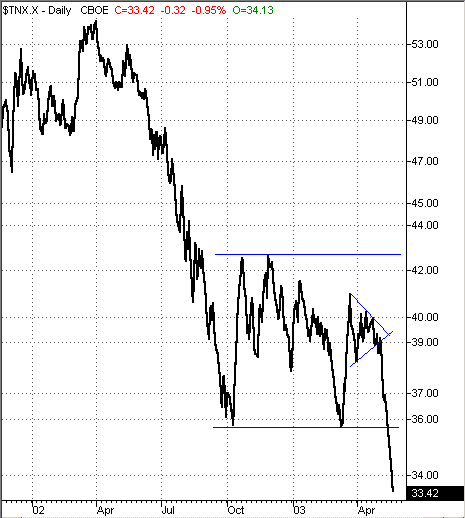
| Record lows in the $TNX are about to get even lower. |
| Graphic provided by: TradeStation. |
| |
| Believe it or not, it could be even worse. I had been watching the symmetrical triangle in 10-year Treasury note yields index ($TNX) unfold since mid-April. While yields, as represented by the index had been lower- and recently- it seemed relatively unlikely that $TNX would revisit the lows of early October 2002 or mid-March 2003. Yet, the measurement rule for the triangle clearly suggested that not only would 10-year T-note yields move lower, but that they would easily test record lows. |
| Consider the triangle that developed at the end of March and into mid-April. The symmetrical triangle is simply price action that experiences both higher lows and lower highs at a more or less similar rate. A trendline connecting the highs during this price action should converge with a trendline connecting the lows, creating the symmetrical triangle consolidation. Triangles can anticipate both reversals and continuations. Most centrally, they reflect a temporary contraction in volatility from which greater volatility- to the upside or to the downside- is usually successfully anticipated. |
| With a formation high of 41, a formation low of 38 and a breakdown point of about 39, the $TNX was expected to drop to 36 (or 3.6%) in minimum move. This downswing occurred almost without a hitch- one brief, post-break pullback as $TNX reached its target in about seven trading days. Insofar as its target also represented a test of the October and March lows, the question of whether or not prices would find or break through support became paramount. One tool in determining the possibility of further declines was a measurement of the consolidation range of which the symmetrical triangle was a small part. This range stretches back to October 2002, with support just below 36 and resistance above at about 42.5. If the consolidation above support mirrors the extent of any decline beneath support (an application of Stan Weinstein's swing rule from Secrets for Profiting in Bull and Bear Markets), then it is quite possible that $TNX will fall to as low as 29, translating roughly into a 2.9% coupon on the 10-year T-note. |
Technical Writer for Technical Analysis of STOCKS & COMMODITIES magazine, Working-Money.com, and Traders.com Advantage.
| Title: | Technical Writer |
| Company: | Technical Analysis, Inc. |
| Address: | 4757 California Avenue SW |
| Seattle, WA 98116 | |
| Phone # for sales: | 206 938 0570 |
| Fax: | 206 938 1307 |
| Website: | www.Traders.com |
| E-mail address: | DPenn@traders.com |
Traders' Resource Links | |
| Charting the Stock Market: The Wyckoff Method -- Books | |
| Working-Money.com -- Online Trading Services | |
| Traders.com Advantage -- Online Trading Services | |
| Technical Analysis of Stocks & Commodities -- Publications and Newsletters | |
| Working Money, at Working-Money.com -- Publications and Newsletters | |
| Traders.com Advantage -- Publications and Newsletters | |
| Professional Traders Starter Kit -- Software | |
Click here for more information about our publications!
PRINT THIS ARTICLE

Request Information From Our Sponsors
- StockCharts.com, Inc.
- Candle Patterns
- Candlestick Charting Explained
- Intermarket Technical Analysis
- John Murphy on Chart Analysis
- John Murphy's Chart Pattern Recognition
- John Murphy's Market Message
- MurphyExplainsMarketAnalysis-Intermarket Analysis
- MurphyExplainsMarketAnalysis-Visual Analysis
- StockCharts.com
- Technical Analysis of the Financial Markets
- The Visual Investor
- VectorVest, Inc.
- Executive Premier Workshop
- One-Day Options Course
- OptionsPro
- Retirement Income Workshop
- Sure-Fire Trading Systems (VectorVest, Inc.)
- Trading as a Business Workshop
- VectorVest 7 EOD
- VectorVest 7 RealTime/IntraDay
- VectorVest AutoTester
- VectorVest Educational Services
- VectorVest OnLine
- VectorVest Options Analyzer
- VectorVest ProGraphics v6.0
- VectorVest ProTrader 7
- VectorVest RealTime Derby Tool
- VectorVest Simulator
- VectorVest Variator
- VectorVest Watchdog
