HOT TOPICS LIST
- MACD
- Fibonacci
- RSI
- Gann
- ADXR
- Stochastics
- Volume
- Triangles
- Futures
- Cycles
- Volatility
- ZIGZAG
- MESA
- Retracement
- Aroon
INDICATORS LIST
LIST OF TOPICS
PRINT THIS ARTICLE
by Gary Grosschadl
Altera (ALTR) has been in a strong rising trend but is showing signs of weakness.
Position: Hold
Gary Grosschadl
Independent Canadian equities trader and technical analyst based in Peterborough
Ontario, Canada.
PRINT THIS ARTICLE
WEDGE FORMATIONS
Altera Corporation Shows a Rising Wedge
05/22/03 09:58:49 AMby Gary Grosschadl
Altera (ALTR) has been in a strong rising trend but is showing signs of weakness.
Position: Hold
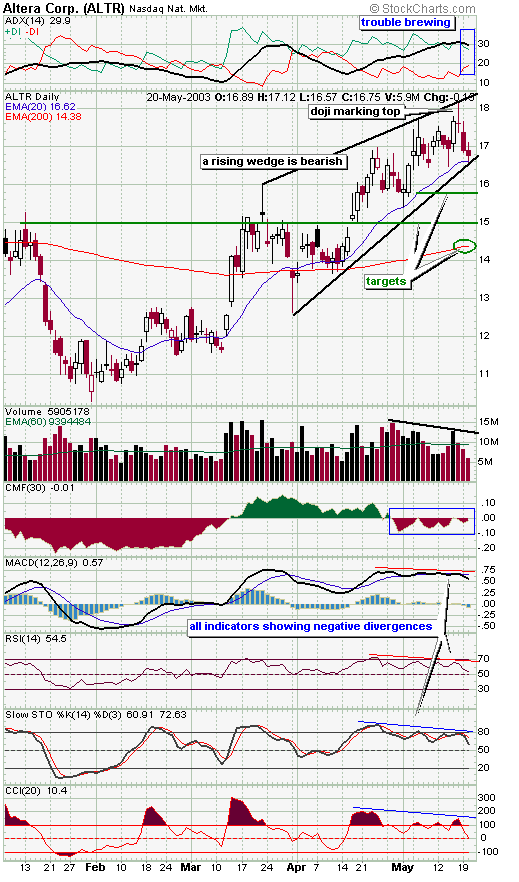
| Since dipping below $11 last February, this stock has been on a tear until recently when it hit $18. A doji candlestick marked the peak. These types of candlesticks often serve as top warnings. Now other warning signs abound with a bearish rising wedge being prominent. This pattern can be viewed as a reversal pattern and volume ideally declines as the wedge progresses, showing less bullish conviction with each successive high in the pattern. Confirmation comes with a breakdown of the lower trendline with bigger volume showing stronger conviction. In this chart the 20-day EMA has offered good support through this stock's rise and now closely aligns with the wedge's lower trendline. Any time a strong stock breaks below its 20-day EMA it is noteworthy and it takes on extra significance when it occurs in conjunction with a wedge pattern. There is no measurement to estimate the decline with such a pattern so other factors have to be considered. |
| As usual when a bearish pattern evolves, it is not hard to find corroborating evidence from indicator analysis. The directional movement indicator at the top of the chart shows conditions deteriorating. The ADX line is now showing signs of coming off a peak and reversing, indicating that the current trend is weakening. At the same time the DIs are starting to converge which shows the bull's strength beginning to wane while bearish power starts to increase. |

|
| Daily chart for Altera Corp. |
| Graphic provided by: Stockcharts.com. |
| |
| The CMI or Chaiken Money Flow Indicator is a measure of buying or selling power pertaining to supply and demand. For several months this indicator has been in positive territory but the past several weeks it has turned down into the negative zone. Buying pressure has been replaced with selling pressure. Interestingly this selling pressure has abated somewhat as traders anticipate a possible bounce off the trendline. The other displayed indicators also show similar negative divergences to price action. |
| It is possible that the bearish pattern has not finished evolving and a bounce off the lower trendline may occur. This is why it is important to see an actual breakdown below the wedge with some convincing volume. When this finally does occur this stock becomes a sell or a short candidate- watch for possible reversals from target areas as illustrated. The first is the bottom of a congestion area, the second encompasses previous small gaps, and the lowest one is the 200-day EMA. |
Independent Canadian equities trader and technical analyst based in Peterborough
Ontario, Canada.
| Website: | www.whatsonsale.ca/financial.html |
| E-mail address: | gwg7@sympatico.ca |
Click here for more information about our publications!
PRINT THIS ARTICLE

Request Information From Our Sponsors
- StockCharts.com, Inc.
- Candle Patterns
- Candlestick Charting Explained
- Intermarket Technical Analysis
- John Murphy on Chart Analysis
- John Murphy's Chart Pattern Recognition
- John Murphy's Market Message
- MurphyExplainsMarketAnalysis-Intermarket Analysis
- MurphyExplainsMarketAnalysis-Visual Analysis
- StockCharts.com
- Technical Analysis of the Financial Markets
- The Visual Investor
- VectorVest, Inc.
- Executive Premier Workshop
- One-Day Options Course
- OptionsPro
- Retirement Income Workshop
- Sure-Fire Trading Systems (VectorVest, Inc.)
- Trading as a Business Workshop
- VectorVest 7 EOD
- VectorVest 7 RealTime/IntraDay
- VectorVest AutoTester
- VectorVest Educational Services
- VectorVest OnLine
- VectorVest Options Analyzer
- VectorVest ProGraphics v6.0
- VectorVest ProTrader 7
- VectorVest RealTime Derby Tool
- VectorVest Simulator
- VectorVest Variator
- VectorVest Watchdog
