HOT TOPICS LIST
- MACD
- Fibonacci
- RSI
- Gann
- ADXR
- Stochastics
- Volume
- Triangles
- Futures
- Cycles
- Volatility
- ZIGZAG
- MESA
- Retracement
- Aroon
INDICATORS LIST
LIST OF TOPICS
PRINT THIS ARTICLE
by Gary Grosschadl
This higher education provider has had a strong run but is now looking like a sell.
Position: Sell
Gary Grosschadl
Independent Canadian equities trader and technical analyst based in Peterborough
Ontario, Canada.
PRINT THIS ARTICLE
CHART ANALYSIS
Apollo Group Changing Course
05/23/03 10:12:14 AMby Gary Grosschadl
This higher education provider has had a strong run but is now looking like a sell.
Position: Sell
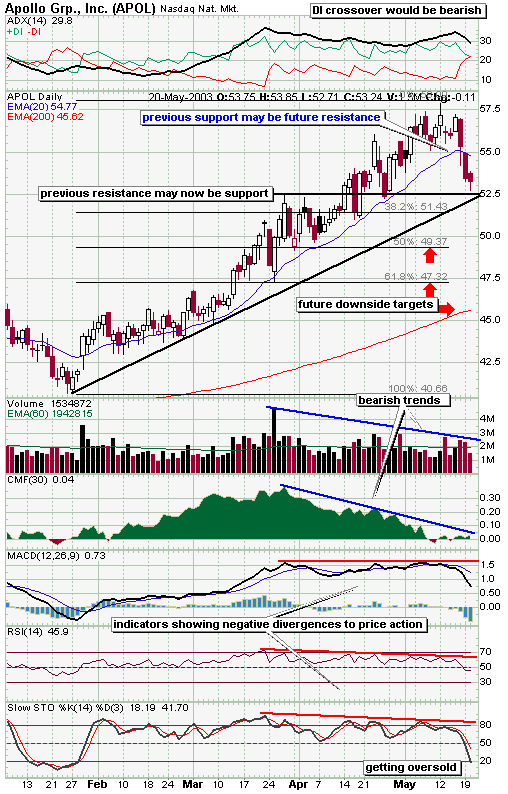
| The daily chart of Apollo Group (APOL) is showing an early trend change via its 20-day EMA (exponential moving average). Typically when a stock is having a strong run, good support is found at this often used moving average, and this chart offers a very good example of how such support occurred over a period of several months. Now the stock has made a decidedly bearish move below this MA and this serves as a likely heads up to problems ahead. Note how moving averages can act as near perfect trendlines at times, even at steeper inclines. |
| Looking at the indicators, warning signs are flashing at those holding long positions. Starting at the top, the trend strength indicator, known as directional movement, is poised for a bearish crossover of its DI components. This would be the first one in several months. If the -DI (red) crosses and stays over the +DI then the bears assume power over the bulls. Volume and the CMF (Chaiken Money Flow) have been in a decline as prices have moved up, showing less conviction by the bulls during this rise. Similarily the other indicators are also showing negative divergence to price action as displayed. When new highs are not confirmed by several indicators, it is often a precursor to trouble ahead. |

|
| Daily chart for APOL. |
| Graphic provided by: Stockcharts.com. |
| |
| After three down days APOL may find some support at this previous resistance level of $52.50. If it does not, then the downside targets are shown using Fibonacci retracement levels. Note that they line up well with relevent candlestick areas. However since stochastics are very near oversold levels (below 20), a move back up to test the 20-day EMA would not be unusual. In that case watch to see if that test fails. Once a stock loses support from this moving average it often becomes an overhead curse or wall of resistance, setting up a series of bear rallies that fail at or very near that line. In that case watch for bounces or support from the target areas displayed. The 200-day EMA may come into the picture as lower support. |
| So in summary, watch to see if the current level holds as support, temporary or otherwise. If you are holding stock and are looking for an exit, you may get a better price at or near the 20-day EMA as long as this $52.50 level holds. Those looking to take a short position will also be watching these levels carefully. Take your cue from success or failure at these likely critical points. Also do not rule out a surprise move back above the 20-day EMA although this seems unlikely. |
Independent Canadian equities trader and technical analyst based in Peterborough
Ontario, Canada.
| Website: | www.whatsonsale.ca/financial.html |
| E-mail address: | gwg7@sympatico.ca |
Click here for more information about our publications!
Comments
Date: 05/26/03Rank: 5Comment: You guys are great. Keep up the good work. I ve always had more trouble on figuring out when to sell a stock. I ve always been good at determining entry points but have had trouble getting the most meat out of a stocks up move. Your article hits the spot.

Request Information From Our Sponsors
- StockCharts.com, Inc.
- Candle Patterns
- Candlestick Charting Explained
- Intermarket Technical Analysis
- John Murphy on Chart Analysis
- John Murphy's Chart Pattern Recognition
- John Murphy's Market Message
- MurphyExplainsMarketAnalysis-Intermarket Analysis
- MurphyExplainsMarketAnalysis-Visual Analysis
- StockCharts.com
- Technical Analysis of the Financial Markets
- The Visual Investor
- VectorVest, Inc.
- Executive Premier Workshop
- One-Day Options Course
- OptionsPro
- Retirement Income Workshop
- Sure-Fire Trading Systems (VectorVest, Inc.)
- Trading as a Business Workshop
- VectorVest 7 EOD
- VectorVest 7 RealTime/IntraDay
- VectorVest AutoTester
- VectorVest Educational Services
- VectorVest OnLine
- VectorVest Options Analyzer
- VectorVest ProGraphics v6.0
- VectorVest ProTrader 7
- VectorVest RealTime Derby Tool
- VectorVest Simulator
- VectorVest Variator
- VectorVest Watchdog
