HOT TOPICS LIST
- MACD
- Fibonacci
- RSI
- Gann
- ADXR
- Stochastics
- Volume
- Triangles
- Futures
- Cycles
- Volatility
- ZIGZAG
- MESA
- Retracement
- Aroon
INDICATORS LIST
LIST OF TOPICS
PRINT THIS ARTICLE
by Kevin Hopson
Transocean Inc. (RIG) has been in a two-and-half-year downtrend but pitchfork analysis indicates that a reversal has now occurred.
Position: Buy
Kevin Hopson
Kevin has been a technical analyst for roughly 10 years now. Previously, Kevin owned his own business and acted as a registered investment advisor, specializing in energy. He was also a freelance oil analyst for Orient Trading Co., a commodity futures trading firm in Japan. Kevin is currently a freelance writer.
PRINT THIS ARTICLE
TECHNICAL ANALYSIS
A Long-Term Trend Reversal for Transocean Inc.?
05/20/03 08:43:41 AMby Kevin Hopson
Transocean Inc. (RIG) has been in a two-and-half-year downtrend but pitchfork analysis indicates that a reversal has now occurred.
Position: Buy
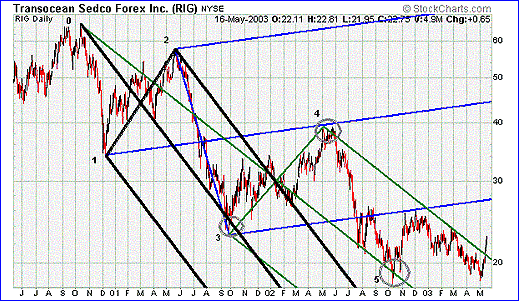
| Transocean Inc. (RIG) is an international provider of deepwater and harsh environment contract drilling services for oil and gas wells. As you can see in the three-year chart, Transocean has been in a clear downtrend since October of 2000. However, pitchfork analysis indicates a potential reversal in the long-term trend, which - if true - could signal much higher prices for the stock. |
| For example, focus your attention on the black pitchfork, which was drawn using pivots 0, 1 and 2 - also known as the 0-1/2 pitchfork. This pitchfork was used to calculate the third pivot or the end of wave 3. More specifically, the third wave should have been completed upon first test of the black median line, which held true. Now take a look at the blue pitchfork, which utilizes pivots 1, 2 and 3 (1-2/3 pitchfork). Prices should have reversed at the blue median line, bringing an end to wave 4. As you can see, this too was accurately predicted. |

|
| Graphic provided by: Stockcharts.com. |
| |
| The final piece of the puzzle was the green pitchfork. This pitchfork was drawn using pivots 0, 3 and 4. Pivots 2, 3 and 4 are normally used in determining the fifth and final wave of a trend. However, when the 2-3/4 pitchfork fails to be a good fit for prices (which was the case with RIG), the 0-3/4 pitchfork is used as an alternative. As you can see, prices reversed when the green median line came into play. |
| Since pitchfork analysis accurately predicted each of the major turning points in Transocean's two-and-a-half-year downtrend and the pivot count coincides with Elliott Wave theory (in that trends tend to occur in waves of five), I believe the stock has put in a significant long-term bottom. In other words, I feel that a major trend reversal has occurred. Additionally, notice how the stock recently broke above last April's downtrend line, which is indicated by the top green parallel line. This was a bullish signal. |
Kevin has been a technical analyst for roughly 10 years now. Previously, Kevin owned his own business and acted as a registered investment advisor, specializing in energy. He was also a freelance oil analyst for Orient Trading Co., a commodity futures trading firm in Japan. Kevin is currently a freelance writer.
| Glen Allen, VA | |
| E-mail address: | hopson_1@yahoo.com |
Click here for more information about our publications!
Comments
Date: 05/22/03Rank: 5Comment:
Date: 05/22/03Rank: 5Comment:
Date: 05/27/03Rank: 4Comment:

|

Request Information From Our Sponsors
- StockCharts.com, Inc.
- Candle Patterns
- Candlestick Charting Explained
- Intermarket Technical Analysis
- John Murphy on Chart Analysis
- John Murphy's Chart Pattern Recognition
- John Murphy's Market Message
- MurphyExplainsMarketAnalysis-Intermarket Analysis
- MurphyExplainsMarketAnalysis-Visual Analysis
- StockCharts.com
- Technical Analysis of the Financial Markets
- The Visual Investor
- VectorVest, Inc.
- Executive Premier Workshop
- One-Day Options Course
- OptionsPro
- Retirement Income Workshop
- Sure-Fire Trading Systems (VectorVest, Inc.)
- Trading as a Business Workshop
- VectorVest 7 EOD
- VectorVest 7 RealTime/IntraDay
- VectorVest AutoTester
- VectorVest Educational Services
- VectorVest OnLine
- VectorVest Options Analyzer
- VectorVest ProGraphics v6.0
- VectorVest ProTrader 7
- VectorVest RealTime Derby Tool
- VectorVest Simulator
- VectorVest Variator
- VectorVest Watchdog
