HOT TOPICS LIST
- MACD
- Fibonacci
- RSI
- Gann
- ADXR
- Stochastics
- Volume
- Triangles
- Futures
- Cycles
- Volatility
- ZIGZAG
- MESA
- Retracement
- Aroon
INDICATORS LIST
LIST OF TOPICS
PRINT THIS ARTICLE
by Kevin Hopson
Nexen Inc. (NXY) had been stuck in a seven-month trading range but the recent channel breakout now indicates higher prices in the long-term.
Position: Accumulate
Kevin Hopson
Kevin has been a technical analyst for roughly 10 years now. Previously, Kevin owned his own business and acted as a registered investment advisor, specializing in energy. He was also a freelance oil analyst for Orient Trading Co., a commodity futures trading firm in Japan. Kevin is currently a freelance writer.
PRINT THIS ARTICLE
CHANNEL LINES
Nexen's Channel Breakout
05/19/03 10:59:21 AMby Kevin Hopson
Nexen Inc. (NXY) had been stuck in a seven-month trading range but the recent channel breakout now indicates higher prices in the long-term.
Position: Accumulate
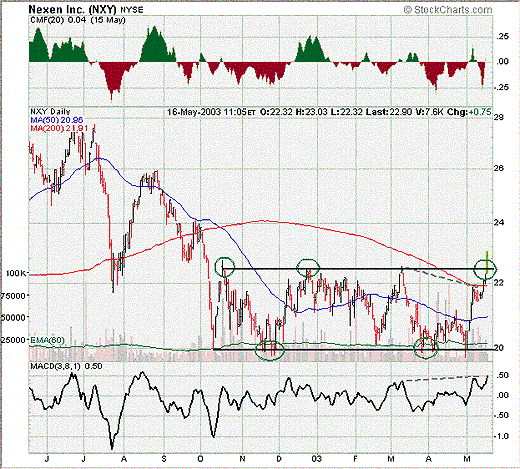
| Nexen Inc. (NXY) is engaged in the exploration, development, production and marketing of crude oil and natural gas, as well as alternate fuels and chemicals. The stock had been stuck in a seven-month trading range between $20.00 and $22.40. However, Nexen has now broken out of this trading range, indicating higher prices in the long-term. |
| There were two things that indicated an eventual upside breakout from this trading range. First, notice in the chart how the moving average convergence/divergence (MACD) recently put in a higher high while the stock price put in a lower high. This is indicated by the dotted gray lines. This was a bullish divergence and indicated additional strength in the near-term. |

|
| Graphic provided by: StockCharts.com. |
| |
| Additionally, a stock normally breaks in the direction of the fifth channel test. In other words, notice how Nexen tested the top and bottom channel lines five times - in alternate sequence. Since the fifth test occurred along the top channel line, it was an indication that the stock would likely break to the upside. |
| Now that this has occurred, the channel breakout indicates a long-term upside target of between $27.00 and $30.00. As a result, I would look to accumulate the stock on any near-term weakness. More specifically, the $22.00 to $22.50 range - site of the recent quadruple top breakout and the stock's 200-day moving average - appears to be a good entry point. |
Kevin has been a technical analyst for roughly 10 years now. Previously, Kevin owned his own business and acted as a registered investment advisor, specializing in energy. He was also a freelance oil analyst for Orient Trading Co., a commodity futures trading firm in Japan. Kevin is currently a freelance writer.
| Glen Allen, VA | |
| E-mail address: | hopson_1@yahoo.com |
Click here for more information about our publications!
Comments
Date: 05/22/03Rank: 5Comment:

Request Information From Our Sponsors
- StockCharts.com, Inc.
- Candle Patterns
- Candlestick Charting Explained
- Intermarket Technical Analysis
- John Murphy on Chart Analysis
- John Murphy's Chart Pattern Recognition
- John Murphy's Market Message
- MurphyExplainsMarketAnalysis-Intermarket Analysis
- MurphyExplainsMarketAnalysis-Visual Analysis
- StockCharts.com
- Technical Analysis of the Financial Markets
- The Visual Investor
- VectorVest, Inc.
- Executive Premier Workshop
- One-Day Options Course
- OptionsPro
- Retirement Income Workshop
- Sure-Fire Trading Systems (VectorVest, Inc.)
- Trading as a Business Workshop
- VectorVest 7 EOD
- VectorVest 7 RealTime/IntraDay
- VectorVest AutoTester
- VectorVest Educational Services
- VectorVest OnLine
- VectorVest Options Analyzer
- VectorVest ProGraphics v6.0
- VectorVest ProTrader 7
- VectorVest RealTime Derby Tool
- VectorVest Simulator
- VectorVest Variator
- VectorVest Watchdog
