HOT TOPICS LIST
- MACD
- Fibonacci
- RSI
- Gann
- ADXR
- Stochastics
- Volume
- Triangles
- Futures
- Cycles
- Volatility
- ZIGZAG
- MESA
- Retracement
- Aroon
INDICATORS LIST
LIST OF TOPICS
PRINT THIS ARTICLE
by Koos van der Merwe
Rambus is a company that has been plagued by litigation. It derives all of its revenue not from the sale of computer chips, but from fees and royalties paid by chip companies who licence their intellectual property for use in their products. It won its last dispute, which is why the price rose so strongly. Does this mean its troubles are over?
Position: Hold
Koos van der Merwe
Has been a technical analyst since 1969, and has worked as a futures and options trader with First Financial Futures in Johannesburg, South Africa.
PRINT THIS ARTICLE
TECHNICAL INDICATORS
Rambus
05/19/03 12:35:07 PMby Koos van der Merwe
Rambus is a company that has been plagued by litigation. It derives all of its revenue not from the sale of computer chips, but from fees and royalties paid by chip companies who licence their intellectual property for use in their products. It won its last dispute, which is why the price rose so strongly. Does this mean its troubles are over?
Position: Hold
| Rambus (RMBS) was listed on the market in the days before the tech bubble of 2000. At its peak, it touched $127 on June 23, 2000, well after the bubbles peak in March, which showed that investors believed in the company, but since that day, its share price started falling, and fell steadily to reach a low of $3.17 on January 29, 2003. What a spectacular fall, and yet they have a good product, and a good income from royalties on products they patented. This is what the court cases were about, and as long doubt existed as to the outcome of those legal battles, the share price fell. |
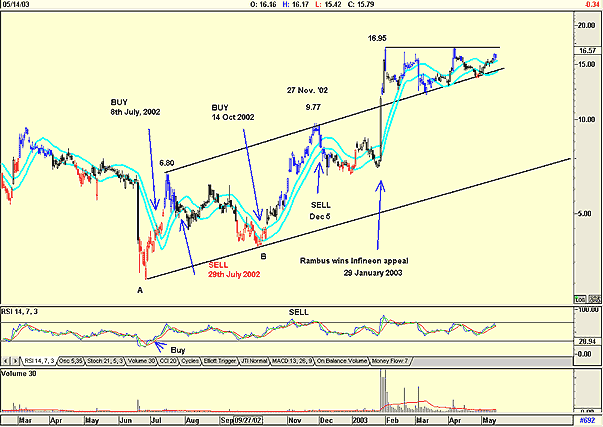
| A look at the chart shows that Rambus started reversing its fall with a buy signal given by the RSI indicator on July 2nd, 2002. Previous RSI buy signals had led to short-term gains, as the outcome of litigation weighed on the share price, causing sharp drops after any attempted rally. On July 8th, 2002 it gave a JM buy signal and rose on a gap to $6.80 before falling to give a JM sell signal. From there it flirted with the JM band, a star for traders, until it hit a low of $3.94 on October 7th, 2002. It rose, with an RSI not showing a definite signal - more of a sideways movement. Volume, not that obvious on the chart, was below or at average, so there was no advance signal that the chart would move upwards. |

|
| Figure 1: Rambus. |
| Graphic provided by: AdvancedGET. |
| |
| The JM internal moving average band is a 15-period moving average offset, in the case of Rambus by 4% and -4%. A break above the upper band is a buy signal, and a break below the lower band, a sell signal. The 4%, -4% offset is visually determined to reduce buy/sell whipsaws. The low formed at B allowed me to draw a support line, AB, trending upwards. Drawing a parallel line from the $6.80 high, I now had a possible target for the price should the upmove continue. A JM buy signal was given on October 14, 2002 and the price rose to the resistance line at $9.77 on November 27, 2002 with the RSI above the 70 level, confirming a sell signal. The share gave a JM sell on Dec 5th, and instead of falling to the support level as expected, traded around the JM band line, probably as speculators played with the share knowing that the court case verdict was imminent. On the 29th of January Rambus won its case and the share price jumped on exceptionally strong volume, breaking through the resistance line and topping out at $16.95. Since then it has been trading sideways, using the previous resistance trendline, as a support line. |
| But for now, is Rambus forming a triangle or is it simply trading sideways? Neither the RSI indicator, nor volume are any help here. However, a break above $16.95 will see it move up strongly. To calculate a possible target, I looked to a point and figure horizontal count rather than determining a target from what I consider to be a suspect triangle. |
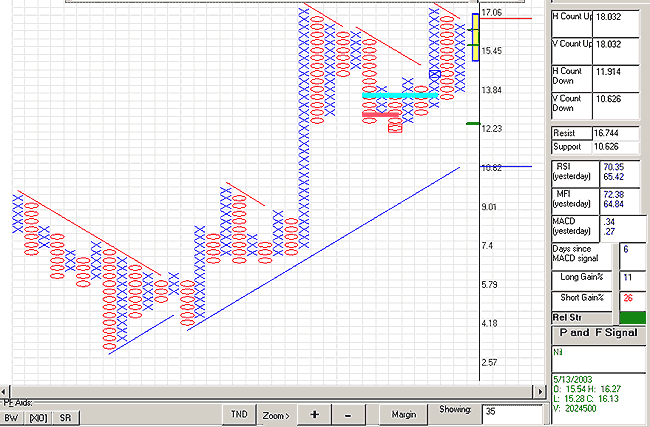
 Figure 2: Point and figure chart of RMBS. Graphic provided by PF Scan. The P&F chart of Rambus looks very interesting, suggesting that a break above $17.06 would be a buy signal. Its horizontal target is calculated at $18.032 as is the vertical count target. Using a preferred 2:5 risk/reward ratio, (stop-loss would be 10% of 17.06 = 1.70; 1.70 x 2.50 = 4.25) I would like to see a target of $21.30 ( 17.06 + 4.25 = 21.31) to make the investment worthwhile. To conclude, although the chart of Rambus looks profitable as an investment, at the moment the risk/reward ratio would keep me away from it. Traders on the other hand, could look for a short as it approaches $16.95. |
Has been a technical analyst since 1969, and has worked as a futures and options trader with First Financial Futures in Johannesburg, South Africa.
| Address: | 3256 West 24th Ave |
| Vancouver, BC | |
| Phone # for sales: | 6042634214 |
| E-mail address: | petroosp@gmail.com |
Click here for more information about our publications!
Comments
Date: 05/22/03Rank: 5Comment:
Date: 05/22/03Rank: 5Comment:

Request Information From Our Sponsors
- StockCharts.com, Inc.
- Candle Patterns
- Candlestick Charting Explained
- Intermarket Technical Analysis
- John Murphy on Chart Analysis
- John Murphy's Chart Pattern Recognition
- John Murphy's Market Message
- MurphyExplainsMarketAnalysis-Intermarket Analysis
- MurphyExplainsMarketAnalysis-Visual Analysis
- StockCharts.com
- Technical Analysis of the Financial Markets
- The Visual Investor
- VectorVest, Inc.
- Executive Premier Workshop
- One-Day Options Course
- OptionsPro
- Retirement Income Workshop
- Sure-Fire Trading Systems (VectorVest, Inc.)
- Trading as a Business Workshop
- VectorVest 7 EOD
- VectorVest 7 RealTime/IntraDay
- VectorVest AutoTester
- VectorVest Educational Services
- VectorVest OnLine
- VectorVest Options Analyzer
- VectorVest ProGraphics v6.0
- VectorVest ProTrader 7
- VectorVest RealTime Derby Tool
- VectorVest Simulator
- VectorVest Variator
- VectorVest Watchdog
