HOT TOPICS LIST
- MACD
- Fibonacci
- RSI
- Gann
- ADXR
- Stochastics
- Volume
- Triangles
- Futures
- Cycles
- Volatility
- ZIGZAG
- MESA
- Retracement
- Aroon
INDICATORS LIST
LIST OF TOPICS
PRINT THIS ARTICLE
by David Penn
An island bottom and rising MACD point toward higher copper prices going forward.
Position: N/A
David Penn
Technical Writer for Technical Analysis of STOCKS & COMMODITIES magazine, Working-Money.com, and Traders.com Advantage.
PRINT THIS ARTICLE
ISLAND REVERSAL
Copper Comes Back
05/15/03 12:44:30 PMby David Penn
An island bottom and rising MACD point toward higher copper prices going forward.
Position: N/A
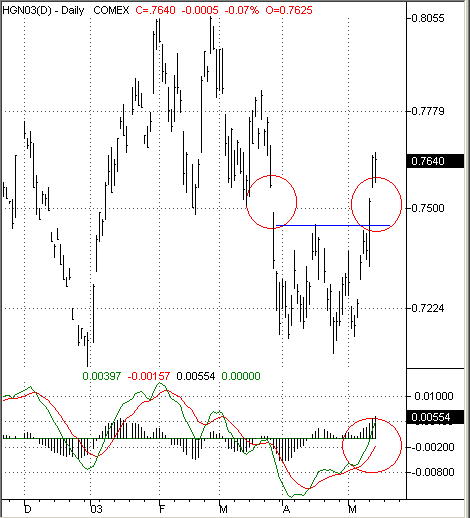
| Having spent most of the first part of this year warning about the bearish reversal looming in copper futures ("Copper Tops," Traders.com Advantage, February 28, 2003; "Revisiting Copper Tops," Traders.com Advantage, March 26, 2003), it appears as if the second quarter of 2003 will have me looking at copper's bullish opportunities. The present technical picture for July copper is full of bullish portents--from an island bottom to a 2B test of intermediate bottom to a moving average convergence/divergence indicator moving strongly up toward and through the zero line. |
| To put copper in context, observe that the April lows in copper (again, basis July) came in the wake of copper's decline from contract highs in February. From highs of about 0.8055 then, copper prices fell to less than 0.7200. In almost a perfect inverse of the "double top" that anticipated copper's decline in February, July copper has formed a "double bottom" in April. Additionally, on its way down toward forming this double bottom, copper prices gapped down in late March, forming what appears to be the first half of an island bottom. The second half of the island bottom occurred as copper prices began moving back up in May--including the requisite "gap up" early in the month--also completing the double bottom-like formation. |

|
| Chart patterns, indicators and set-ups all point to a bullish reversal in July copper. |
| Graphic provided by: TradeStation. |
| |
| Also worth mentioning is the moving average convergence/divergence indicator (MACD) which bottom early in April. Note how the MACD--particularly the green "trigger" line--made a higher low near the end of April at the same time that price action was making a lower low with the second trough of the double bottom/island bottom. This is evidence of a positive divergence between the indicator and price action (a bullish indicator contrasting with still-bearish price action), and such divergences are often excellent signals that price action is likely to reverse and manifest the direction suggested by the indicator. |
| Lastly, with regard to reversal clues, is the 2B test of bottom. One of the wonderful things about this indicator/set-up developed by Victor Sperandeo ("Trader Vic--Methods of a Wall Street Master") is the way the 2B test can allow a trader to catch a reversal exceptionally early in the process when gains from a reversal are likely to be at their greatest. Here, an intermediate 2B test of bottom occurs when July copper makes a low in early April, then rallies to mid-month before again retreating, this time making an even lower low late in April. When prices fail to follow-through on the late April lower low, then the 2B test suggests that the likelihood of a reversal is significant. Prices, in fact, rallied sharply from this failure to follow-through. Even as July copper pulled back at the beginning of May, the late April lows held. |
| Both the island bottom and the "double bottom" are bullish reversal patterns and the upside both patterns suggest is also similar. I like to use Stan Weinstein's "swing rule" (from his book "Secrets for Profiting in Bull and Bear Markets") which in this instance calls for adding the formation size of 0.0350 (measured from the high point in the formation to the low point) to the value at the top of the formation--here, the resistance level at 0.7455. A rally or breakout that reached this level would then likely set up a test of the late March high at 0.7840. |
Technical Writer for Technical Analysis of STOCKS & COMMODITIES magazine, Working-Money.com, and Traders.com Advantage.
| Title: | Technical Writer |
| Company: | Technical Analysis, Inc. |
| Address: | 4757 California Avenue SW |
| Seattle, WA 98116 | |
| Phone # for sales: | 206 938 0570 |
| Fax: | 206 938 1307 |
| Website: | www.Traders.com |
| E-mail address: | DPenn@traders.com |
Traders' Resource Links | |
| Charting the Stock Market: The Wyckoff Method -- Books | |
| Working-Money.com -- Online Trading Services | |
| Traders.com Advantage -- Online Trading Services | |
| Technical Analysis of Stocks & Commodities -- Publications and Newsletters | |
| Working Money, at Working-Money.com -- Publications and Newsletters | |
| Traders.com Advantage -- Publications and Newsletters | |
| Professional Traders Starter Kit -- Software | |
Click here for more information about our publications!
Comments
Date: 05/27/03Rank: 3Comment:

Request Information From Our Sponsors
- StockCharts.com, Inc.
- Candle Patterns
- Candlestick Charting Explained
- Intermarket Technical Analysis
- John Murphy on Chart Analysis
- John Murphy's Chart Pattern Recognition
- John Murphy's Market Message
- MurphyExplainsMarketAnalysis-Intermarket Analysis
- MurphyExplainsMarketAnalysis-Visual Analysis
- StockCharts.com
- Technical Analysis of the Financial Markets
- The Visual Investor
- VectorVest, Inc.
- Executive Premier Workshop
- One-Day Options Course
- OptionsPro
- Retirement Income Workshop
- Sure-Fire Trading Systems (VectorVest, Inc.)
- Trading as a Business Workshop
- VectorVest 7 EOD
- VectorVest 7 RealTime/IntraDay
- VectorVest AutoTester
- VectorVest Educational Services
- VectorVest OnLine
- VectorVest Options Analyzer
- VectorVest ProGraphics v6.0
- VectorVest ProTrader 7
- VectorVest RealTime Derby Tool
- VectorVest Simulator
- VectorVest Variator
- VectorVest Watchdog
