HOT TOPICS LIST
- MACD
- Fibonacci
- RSI
- Gann
- ADXR
- Stochastics
- Volume
- Triangles
- Futures
- Cycles
- Volatility
- ZIGZAG
- MESA
- Retracement
- Aroon
INDICATORS LIST
LIST OF TOPICS
PRINT THIS ARTICLE
by David Penn
A 1-2-3 trend reversal marks a bottom in corn futures.
Position: N/A
David Penn
Technical Writer for Technical Analysis of STOCKS & COMMODITIES magazine, Working-Money.com, and Traders.com Advantage.
PRINT THIS ARTICLE
REVERSAL
Corn Turns the Corner
05/15/03 12:43:16 PMby David Penn
A 1-2-3 trend reversal marks a bottom in corn futures.
Position: N/A
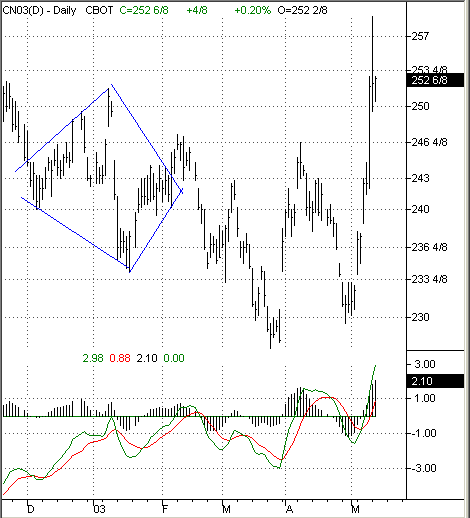
| After corn fell from $2.93 in September 2002 to less than $2.39 in January 2003 (basis July), I began to suspect that, perhaps, corn futures were finally making a bottom. As I argued in a piece in February ("A Bottom in Grains?", Traders.com Advantage, February 18, 2003), it appeared as if a diamond bottom was developing in January, a bullish reversal pattern that suggested that higher prices for corn futures were clearly possible. Unfortunately for corn bulls, after corn broke out to the upside from the diamond, it reversed course sharply in February and fell, testing its January lows at the end of February and breaking down further beneath these lows in March. |

|
| Figure 1: The December-January diamond bottom reversal failed in late February, finally reaching a new contract low in late March. |
| Graphic provided by: TradeStation. |
| |
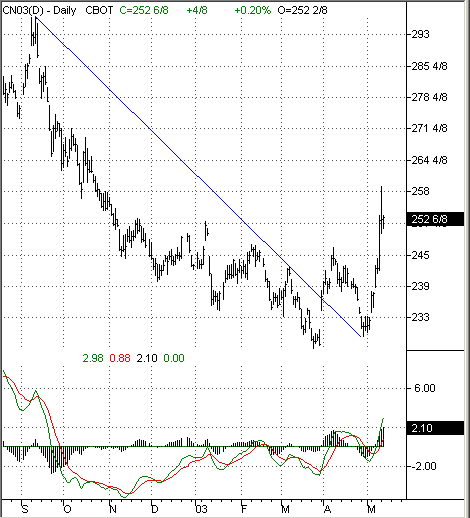
The April rally from the March lows took out the March high, but failed at the February high just north of $2.46 4/8. This was further confirmation that the bears were not yet done with corn, as they sent the grain reeling downward for the balance of the month. Importantly, however, the April lows did not take out the March lows--leaving open the possibility that the higher April low might signify that a bottom in corn had indeed developed. The powerful rally in corn futures that began the month of May seemed to confirm this possibility--as corn rallied from $2.30 to over $2.50 in about seven trading days. Figure 2: This 1-2-3 trend reversal appears to mark a bottom in the eight-month bear market in corn. Is there any way to confirm that a reversal in the eight-month bear market for corn has taken place? My favorite trend reversal analysis tool is Victor Sperandeo's 1-2-3 trend reversal, about which I have written before for Traders.com Advantage (I recommend Sperandeo's 1991 book, "Trader Vic--Methods of a Wall Street Master," in particular, for his in-depth discussion of this approach to confirming trend reversals). The 1-2-3 trend reversal is simple and straightforward, and is easy to apply consistently in order to determine when changes in trend have taken place. In short, the 1-2-3 trend reversal involves (1) a trendline break, (2) an attempt by prices to resume the trend by taking out the preceding low or high, and (3) a move back in the direction of the trendline break, particularly when the move exceeds the level reached by the initial trendline break. In order to use the 1-2-3 trend reversal effectively, it is important to use Sperandeo's method of drawing trendlines, which also has the benefit of being easy to apply consistently. Here is "Trader Vic" in Jack Schwager's book "New Market Wizards" describing his method of drawing trendlines: "In the case of an uptrend line, you draw the line from the lowest low to the highest low immediately preceding highest high, making sure that the connecting point you select does not result in the trend line passing through any prices between the two points." |
| One thing I have noticed about Sperandeo's trendlines is that his rules tend to create trendlines that are not as "sweeping" as those drawn by others. I think these more modest trendlines are probably more accurate than those trendlines that tend to take liberties, for example, by slicing through "inconvenient" prices. Again, there is also the benefit of being able to draw trendlines consistently in any and all circumstances. |
| Here, in the case of the July corn futures contract, we have a downtrend line that connects the highest high (September 2002) to the lowest high (early March 2003) immediately preceding the lowest low (late March 2003). The (1) in the 1-2-3 trend reversal comes with the trend break at the end of March going into April. The (2) in this analysis comes with the move down at the end of April and, importantly, in the failure of prices to make a new low early in May. The (3) comes early in May as corn prices move up above the April high, thus confirming the reversal in trend. Sperandeo, in discussing his 1-2-3 trend reversal notes that because a good amount of the price move is often over by the time the third step arrives, aggressive traders may want to act on the second step: the failure to make a new high or low in the direction of the still-prevailing trend. With prudent risk management (i.e., getting out as soon as a new high or low is made), this is an acceptable approach for those looking to maximize any gains they are able to get as a result of an often major reversal in trend. |
Technical Writer for Technical Analysis of STOCKS & COMMODITIES magazine, Working-Money.com, and Traders.com Advantage.
| Title: | Technical Writer |
| Company: | Technical Analysis, Inc. |
| Address: | 4757 California Avenue SW |
| Seattle, WA 98116 | |
| Phone # for sales: | 206 938 0570 |
| Fax: | 206 938 1307 |
| Website: | www.Traders.com |
| E-mail address: | DPenn@traders.com |
Traders' Resource Links | |
| Charting the Stock Market: The Wyckoff Method -- Books | |
| Working-Money.com -- Online Trading Services | |
| Traders.com Advantage -- Online Trading Services | |
| Technical Analysis of Stocks & Commodities -- Publications and Newsletters | |
| Working Money, at Working-Money.com -- Publications and Newsletters | |
| Traders.com Advantage -- Publications and Newsletters | |
| Professional Traders Starter Kit -- Software | |
Click here for more information about our publications!
Comments

Request Information From Our Sponsors
- StockCharts.com, Inc.
- Candle Patterns
- Candlestick Charting Explained
- Intermarket Technical Analysis
- John Murphy on Chart Analysis
- John Murphy's Chart Pattern Recognition
- John Murphy's Market Message
- MurphyExplainsMarketAnalysis-Intermarket Analysis
- MurphyExplainsMarketAnalysis-Visual Analysis
- StockCharts.com
- Technical Analysis of the Financial Markets
- The Visual Investor
- VectorVest, Inc.
- Executive Premier Workshop
- One-Day Options Course
- OptionsPro
- Retirement Income Workshop
- Sure-Fire Trading Systems (VectorVest, Inc.)
- Trading as a Business Workshop
- VectorVest 7 EOD
- VectorVest 7 RealTime/IntraDay
- VectorVest AutoTester
- VectorVest Educational Services
- VectorVest OnLine
- VectorVest Options Analyzer
- VectorVest ProGraphics v6.0
- VectorVest ProTrader 7
- VectorVest RealTime Derby Tool
- VectorVest Simulator
- VectorVest Variator
- VectorVest Watchdog
