HOT TOPICS LIST
- MACD
- Fibonacci
- RSI
- Gann
- ADXR
- Stochastics
- Volume
- Triangles
- Futures
- Cycles
- Volatility
- ZIGZAG
- MESA
- Retracement
- Aroon
INDICATORS LIST
LIST OF TOPICS
PRINT THIS ARTICLE
by David Penn
In the land of the rising yen, it appears as if the bottom is in.
Position: N/A
David Penn
Technical Writer for Technical Analysis of STOCKS & COMMODITIES magazine, Working-Money.com, and Traders.com Advantage.
PRINT THIS ARTICLE
HEAD & SHOULDERS
Revisiting the Yen's Head and Shoulders Bottom
05/15/03 08:01:21 AMby David Penn
In the land of the rising yen, it appears as if the bottom is in.
Position: N/A
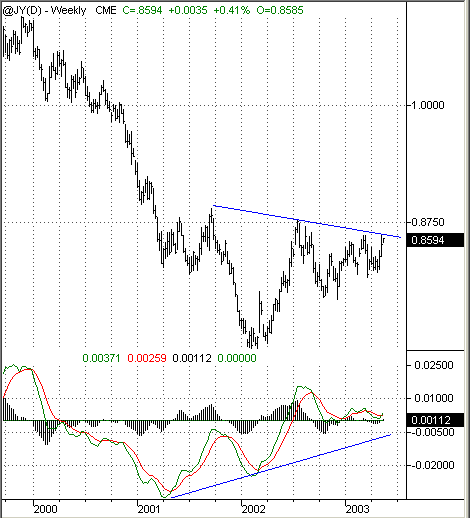
| Back in January, ("The Yen's Head and Shoulders Bottom," Traders.com Advantage, January 24, 2003), I suggested that the Japanese yen, then trading at 0.8505, looked to be completing the right shoulder of a head and shoulders bottom formation that has been about a year and a half in the making. Now, a little over three months later, the yen (basis continuous futures) is only up by a smallish margin (recently trading at 0.8596), but its head and shoulders bottom appears all the more ready to reach completion. |
| The head and shoulders bottom, to recap, is a common consolidation that can occur after an extended downtrend. It consists of three distinct declines, with the second decline being the steepest in the series and the first and third declines usually being of roughly the same size. The resistance level of a head and shoulders bottom is the point where the rallies after the first and second declines peak out, and is referred to as the neckline of the formation. When prices rally in the wake of the third decline and break out above the neckline of the head and shoulders bottom, the formation is said to be complete and a significant move to the upside is expected. While prices at times retrace or pullback to the neckline shortly after breaking out, these pullbacks are usually short-lived and inflict little technical damage to the pattern. Some conservative traders actually trade head and shoulders bottoms by waiting for the pullback to "test" the neckline before entering a trade on the long side. |

|
| An upside breakout from this head and shoulders bottom in the Japanese yen could take the Asian currency as high as 0.9915 before any major retracement. |
| Graphic provided by: TradeStation. |
| |
| Another way of gauging the bullishness of this head and shouders bottom is to use an indicator such as the moving average convergence/divergence (MACD) indicator. Although generally used as a trend-following indicator, the MACD can also be used to spot positive and negative divergences between itself and price action. here, note how the first decline (the left shoulder) in the head and shoulders bottom in the first two quarters of 2001 registers a lower MACD than the second, higher trough (the head) that bottoms in the first quarter of 2002. By the time prices move to the third decline (the right shoulder), the MACD is out of negative territory altogether. In this context, the MACD is indicating a positive divergence (indicator showing strength while price action still reflects weakness) that suggests that prices are likely to move higher. |
Technical Writer for Technical Analysis of STOCKS & COMMODITIES magazine, Working-Money.com, and Traders.com Advantage.
| Title: | Technical Writer |
| Company: | Technical Analysis, Inc. |
| Address: | 4757 California Avenue SW |
| Seattle, WA 98116 | |
| Phone # for sales: | 206 938 0570 |
| Fax: | 206 938 1307 |
| Website: | www.Traders.com |
| E-mail address: | DPenn@traders.com |
Traders' Resource Links | |
| Charting the Stock Market: The Wyckoff Method -- Books | |
| Working-Money.com -- Online Trading Services | |
| Traders.com Advantage -- Online Trading Services | |
| Technical Analysis of Stocks & Commodities -- Publications and Newsletters | |
| Working Money, at Working-Money.com -- Publications and Newsletters | |
| Traders.com Advantage -- Publications and Newsletters | |
| Professional Traders Starter Kit -- Software | |
Click here for more information about our publications!
Comments
Date: 05/16/03Rank: 4Comment:

|

Request Information From Our Sponsors
- StockCharts.com, Inc.
- Candle Patterns
- Candlestick Charting Explained
- Intermarket Technical Analysis
- John Murphy on Chart Analysis
- John Murphy's Chart Pattern Recognition
- John Murphy's Market Message
- MurphyExplainsMarketAnalysis-Intermarket Analysis
- MurphyExplainsMarketAnalysis-Visual Analysis
- StockCharts.com
- Technical Analysis of the Financial Markets
- The Visual Investor
- VectorVest, Inc.
- Executive Premier Workshop
- One-Day Options Course
- OptionsPro
- Retirement Income Workshop
- Sure-Fire Trading Systems (VectorVest, Inc.)
- Trading as a Business Workshop
- VectorVest 7 EOD
- VectorVest 7 RealTime/IntraDay
- VectorVest AutoTester
- VectorVest Educational Services
- VectorVest OnLine
- VectorVest Options Analyzer
- VectorVest ProGraphics v6.0
- VectorVest ProTrader 7
- VectorVest RealTime Derby Tool
- VectorVest Simulator
- VectorVest Variator
- VectorVest Watchdog
