HOT TOPICS LIST
- MACD
- Fibonacci
- RSI
- Gann
- ADXR
- Stochastics
- Volume
- Triangles
- Futures
- Cycles
- Volatility
- ZIGZAG
- MESA
- Retracement
- Aroon
INDICATORS LIST
LIST OF TOPICS
PRINT THIS ARTICLE
by Gary Grosschadl
The short-term action has been bullish and now the longer term is also hinting at a switch to a bullish bias.
Position: Hold
Gary Grosschadl
Independent Canadian equities trader and technical analyst based in Peterborough
Ontario, Canada.
PRINT THIS ARTICLE
CHART ANALYSIS
Will Xerox Copy Success?
05/15/03 07:58:20 AMby Gary Grosschadl
The short-term action has been bullish and now the longer term is also hinting at a switch to a bullish bias.
Position: Hold
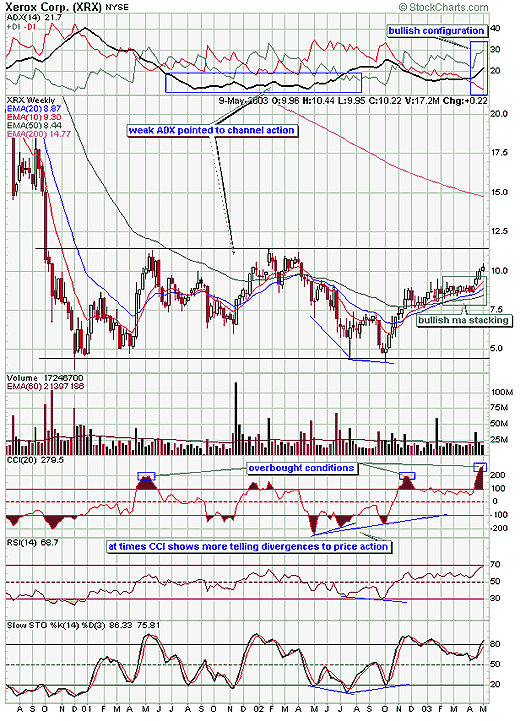
| In a recent article Jack Singer showed a bullish bias via Elliott wave. I was also eying Xerox's bullish potential using complementary views and perhaps this can add weight to what Singer has already spotted. The weekly chart below shows Xerox (XRX) in a wide ranging channel. For the past two years the stock has been contained in a wide and tradeable range. I believe the character of the channel has significantly changed and may allow for an eventual upside break. |
| Xerox had been unable to move beyond the $11.50 barrier and looking at the directional movement indicator I can see how it lacked the power to do so. For the most part ADX was well below 20 while the stock moved in this wide channel. This pointed to a lack of directional power, at least in the sense that a bigger breakout was not possible. But now for the first time this indicator has switched to a bullish bias by virtue of ADX rising above 20 and in between +DI and -DI with +DI being in control (on top of -DI). The ideal mode for bullish trending markets occurs when ADX is upsloping above 20, in between the DIs with +DI on top. Upsloping ADX above 20 shows the current trend is strong or getting stronger while the DI positioning shows whether the bulls (+DI) or the bears (-DI) are in control. |

|
| Weekly chart of Xerox. |
| Graphic provided by: StockCharts.com. |
| |
| The position of the moving averages also points to a change in character on this chart. When a healthy uptrend is established, the moving averages are stacked in descending order with the shortest MA, in this case the 10-week MA, at the top, and the longest at the bottom. This is the first time on this chart that this has occurred. Note that the larger MAs are not fully cooperating and XRX is still below the 200-week MA. Still the proper stacking of the smaller MAs is a bullish switch. |
| The CCI or commodity channel index is an oscillator that is used to identify overbought and oversold conditions and also like other oscillators is useful in spotting divergences to price action. In this case it did a better job of highlighting positive divergences than RSI or stochastics. Note how it picked up a small but tradeable positive divergence (to price action) in the summer of 2002 that the other displayed indicators missed. The current CCI shows an overbought condition but this could persist during periods of strong trending conditions. |
| In summary, Xerox is looking more bullish now than it has for some time and a move to the upper channel trendline is very likely with an eventual topside break coming if the overall market conditions are supportive. A retracement to the 10- or 20-week moving averages before a bullish push past the top channel trendline is also a likely possibility to consider. |
Independent Canadian equities trader and technical analyst based in Peterborough
Ontario, Canada.
| Website: | www.whatsonsale.ca/financial.html |
| E-mail address: | gwg7@sympatico.ca |
Click here for more information about our publications!
PRINT THIS ARTICLE

Request Information From Our Sponsors
- StockCharts.com, Inc.
- Candle Patterns
- Candlestick Charting Explained
- Intermarket Technical Analysis
- John Murphy on Chart Analysis
- John Murphy's Chart Pattern Recognition
- John Murphy's Market Message
- MurphyExplainsMarketAnalysis-Intermarket Analysis
- MurphyExplainsMarketAnalysis-Visual Analysis
- StockCharts.com
- Technical Analysis of the Financial Markets
- The Visual Investor
- VectorVest, Inc.
- Executive Premier Workshop
- One-Day Options Course
- OptionsPro
- Retirement Income Workshop
- Sure-Fire Trading Systems (VectorVest, Inc.)
- Trading as a Business Workshop
- VectorVest 7 EOD
- VectorVest 7 RealTime/IntraDay
- VectorVest AutoTester
- VectorVest Educational Services
- VectorVest OnLine
- VectorVest Options Analyzer
- VectorVest ProGraphics v6.0
- VectorVest ProTrader 7
- VectorVest RealTime Derby Tool
- VectorVest Simulator
- VectorVest Variator
- VectorVest Watchdog
