HOT TOPICS LIST
- MACD
- Fibonacci
- RSI
- Gann
- ADXR
- Stochastics
- Volume
- Triangles
- Futures
- Cycles
- Volatility
- ZIGZAG
- MESA
- Retracement
- Aroon
INDICATORS LIST
LIST OF TOPICS
PRINT THIS ARTICLE
by Kevin Hopson
Spinnaker Exploration looks to have completed the final leg of its one-year downtrend. With the technicals indicating a potential downside reversal in the near-term, investors should consider future weakness as a good buying opportunity.
Position: Accumulate
Kevin Hopson
Kevin has been a technical analyst for roughly 10 years now. Previously, Kevin owned his own business and acted as a registered investment advisor, specializing in energy. He was also a freelance oil analyst for Orient Trading Co., a commodity futures trading firm in Japan. Kevin is currently a freelance writer.
PRINT THIS ARTICLE
TECHNICAL ANALYSIS
Spinnaker Exploration Coming Up On Significant Resistance
05/13/03 08:01:15 AMby Kevin Hopson
Spinnaker Exploration looks to have completed the final leg of its one-year downtrend. With the technicals indicating a potential downside reversal in the near-term, investors should consider future weakness as a good buying opportunity.
Position: Accumulate
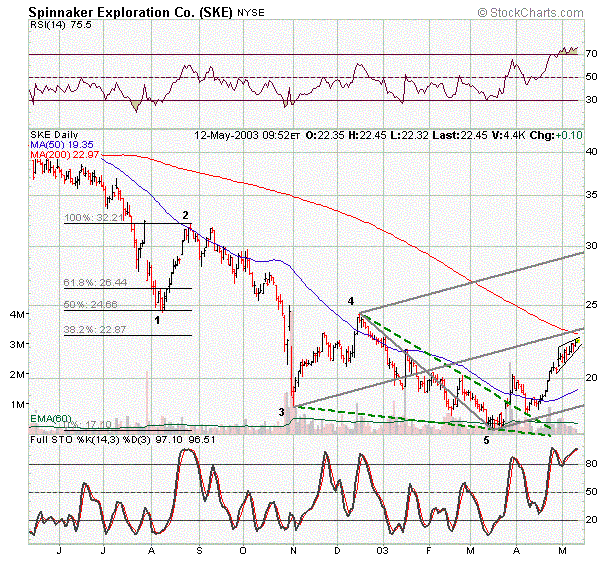
| The last time I touched on Spinnaker Exploration (SKE), the stock was putting in a potential fifth wave in its long-term downtrend. More specifically, Spinnaker appeared to be in the final leg of its one-year downtrend and the large declining wedge formation (which normally breaks to the upside) supported my theory that there would be a significant bottom reversal in the stock. As I anticipated, this occurred in late March. |
| However, as you can see in the chart, the stock is now approaching a significant confluence of resistance. For example, Spinnaker is forming a rising wedge, which is usually resolved by a break to the downside. Furthermore, the stock's 200-day moving average ($22.97), the 38.2 percent retracement level from the Aug. 2002-March 2003 decline ($22.87) and the median line of the gray pitchfork are all converging around the $23.00 level. Combined with the currently overbought conditions, I would consider this a major resistance area and a potential turning point in the stock. |

|
| Graphic provided by: StockCharts.com. |
| |
| However, since I believe we have already seen a major bottom in the stock price, I would look to accumulate on weakness. More specifically, the $19.00 to $20.00 range, site of Spinnaker's 50-day moving average ($19.35) and the stock's recent quadruple top breakout ($20.00), should act as significant support in the near-term. I feel that both short-term traders and long-term investors will be well-rewarded by doing this. |
Kevin has been a technical analyst for roughly 10 years now. Previously, Kevin owned his own business and acted as a registered investment advisor, specializing in energy. He was also a freelance oil analyst for Orient Trading Co., a commodity futures trading firm in Japan. Kevin is currently a freelance writer.
| Glen Allen, VA | |
| E-mail address: | hopson_1@yahoo.com |
Click here for more information about our publications!
PRINT THIS ARTICLE

|

Request Information From Our Sponsors
- StockCharts.com, Inc.
- Candle Patterns
- Candlestick Charting Explained
- Intermarket Technical Analysis
- John Murphy on Chart Analysis
- John Murphy's Chart Pattern Recognition
- John Murphy's Market Message
- MurphyExplainsMarketAnalysis-Intermarket Analysis
- MurphyExplainsMarketAnalysis-Visual Analysis
- StockCharts.com
- Technical Analysis of the Financial Markets
- The Visual Investor
- VectorVest, Inc.
- Executive Premier Workshop
- One-Day Options Course
- OptionsPro
- Retirement Income Workshop
- Sure-Fire Trading Systems (VectorVest, Inc.)
- Trading as a Business Workshop
- VectorVest 7 EOD
- VectorVest 7 RealTime/IntraDay
- VectorVest AutoTester
- VectorVest Educational Services
- VectorVest OnLine
- VectorVest Options Analyzer
- VectorVest ProGraphics v6.0
- VectorVest ProTrader 7
- VectorVest RealTime Derby Tool
- VectorVest Simulator
- VectorVest Variator
- VectorVest Watchdog
