HOT TOPICS LIST
- MACD
- Fibonacci
- RSI
- Gann
- ADXR
- Stochastics
- Volume
- Triangles
- Futures
- Cycles
- Volatility
- ZIGZAG
- MESA
- Retracement
- Aroon
INDICATORS LIST
LIST OF TOPICS
PRINT THIS ARTICLE
by Matt Blackman
Rounding or saucer bottoms are relatively rare but when they show up in any number, the bulls get excited.
Position: N/A
Matt Blackman
Matt Blackman is a full-time technical and financial writer and trader. He produces corporate and financial newsletters, and assists clients in getting published in the mainstream media. He is the host of TradeSystemGuru.com. Matt has earned the Chartered Market Technician (CMT) designation. Find out what stocks and futures Matt is watching on Twitter at www.twitter.com/RatioTrade
PRINT THIS ARTICLE
REVERSAL
Rounding Bottoms Excite Young Bulls
05/12/03 04:10:34 PMby Matt Blackman
Rounding or saucer bottoms are relatively rare but when they show up in any number, the bulls get excited.
Position: N/A
| Like the flowers that bloom in May, rounding bottoms are a good sign that the bear winter is at least temporarily over and a new bullish spring is in the wind. A number of technology and Internet companies have been showing this pattern of late. |

|
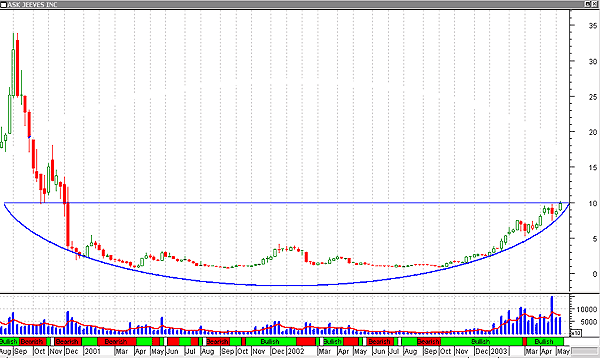
| Figure 1 – Weekly chart of Ask Jeeves (ASKJ) between August 2000 and May 2003 showing a classic rounding or saucer bottom. When accompanied by a similar rounded bottom volume pattern with volume diminishing into the middle of the pattern and then slowly but surely building, it confirms the pattern. A volume breakout at the end of the pattern, as is the case with ASKJ, is even more bullish. |
| Graphic provided by: MetaStock. |
| |
| Rounding patterns can be reversal patterns, as appears to be the case above, or consolidation patterns and take from as little as three weeks to as long as several years to form, according to Martin Pring. Generally, the longer it takes to form, the more reliable the signal. Both tops and bottoms are accompanied by similar bowl-shaped diminishing then increasing volume patterns. |
| From a market psychology standpoint, the bottoming pattern represents gradual falling interest in the equity in the early stages followed by an extended period of slow but quiet accumulation then a final breakout as more market participants become aware of increasing interest in it. |
| Due to the rounding shape, it is difficult to draw trendlines to generate a buy signal but in the example above, there is major resistance at the $10 level. A break above this with volume would be significant and represent a logical buying point, assuming the market continues its upward trajectory. SUGGESTED READING: Pring, Martin [2002]. Technical Analysis Explained, McGraw-Hill. |
Matt Blackman is a full-time technical and financial writer and trader. He produces corporate and financial newsletters, and assists clients in getting published in the mainstream media. He is the host of TradeSystemGuru.com. Matt has earned the Chartered Market Technician (CMT) designation. Find out what stocks and futures Matt is watching on Twitter at www.twitter.com/RatioTrade
| Company: | TradeSystemGuru.com |
| Address: | Box 2589 |
| Garibaldi Highlands, BC Canada | |
| Phone # for sales: | 604-898-9069 |
| Fax: | 604-898-9069 |
| Website: | www.tradesystemguru.com |
| E-mail address: | indextradermb@gmail.com |
Traders' Resource Links | |
| TradeSystemGuru.com has not added any product or service information to TRADERS' RESOURCE. | |
Click here for more information about our publications!
Comments
Date: 05/13/03Rank: 4Comment: good chart pictorial. well drawn resistance lines, even it was very large.
Date: 05/23/03Rank: 4Comment:

Request Information From Our Sponsors
- StockCharts.com, Inc.
- Candle Patterns
- Candlestick Charting Explained
- Intermarket Technical Analysis
- John Murphy on Chart Analysis
- John Murphy's Chart Pattern Recognition
- John Murphy's Market Message
- MurphyExplainsMarketAnalysis-Intermarket Analysis
- MurphyExplainsMarketAnalysis-Visual Analysis
- StockCharts.com
- Technical Analysis of the Financial Markets
- The Visual Investor
- VectorVest, Inc.
- Executive Premier Workshop
- One-Day Options Course
- OptionsPro
- Retirement Income Workshop
- Sure-Fire Trading Systems (VectorVest, Inc.)
- Trading as a Business Workshop
- VectorVest 7 EOD
- VectorVest 7 RealTime/IntraDay
- VectorVest AutoTester
- VectorVest Educational Services
- VectorVest OnLine
- VectorVest Options Analyzer
- VectorVest ProGraphics v6.0
- VectorVest ProTrader 7
- VectorVest RealTime Derby Tool
- VectorVest Simulator
- VectorVest Variator
- VectorVest Watchdog
