HOT TOPICS LIST
- MACD
- Fibonacci
- RSI
- Gann
- ADXR
- Stochastics
- Volume
- Triangles
- Futures
- Cycles
- Volatility
- ZIGZAG
- MESA
- Retracement
- Aroon
INDICATORS LIST
LIST OF TOPICS
PRINT THIS ARTICLE
by David Penn
Both the Gold Bugs Index and Philly Gold and Silver suggest that gold stocks are on their way up.
Position: N/A
David Penn
Technical Writer for Technical Analysis of STOCKS & COMMODITIES magazine, Working-Money.com, and Traders.com Advantage.
PRINT THIS ARTICLE
CUP WITH HANDLE
Cup With Handle Bottoms
05/09/03 01:41:33 PMby David Penn
Both the Gold Bugs Index and Philly Gold and Silver suggest that gold stocks are on their way up.
Position: N/A
| Most of the time, cup with handle formations are consolidations that occur in uptrends and suggest still higher prices once the security breaks out above its consolidation range. This is more or less the received wisdom about cup with handle formations from both William O'Neil--who popularized cup with handle formations in his book, How to Make Money in Stocks--and Thomas Bulkowski--who also wrote insightfully about cup with handle formations in his excellent book, Encyclopedia of Chart Patterns. |
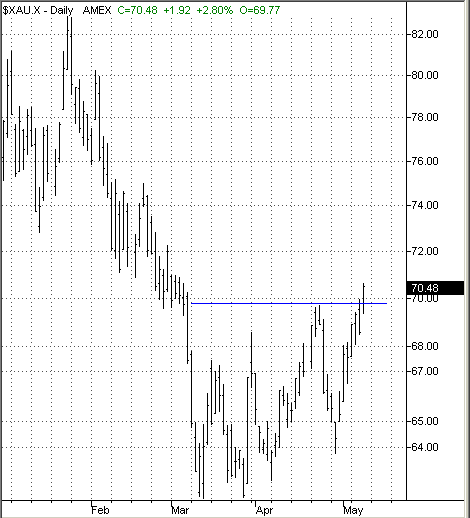
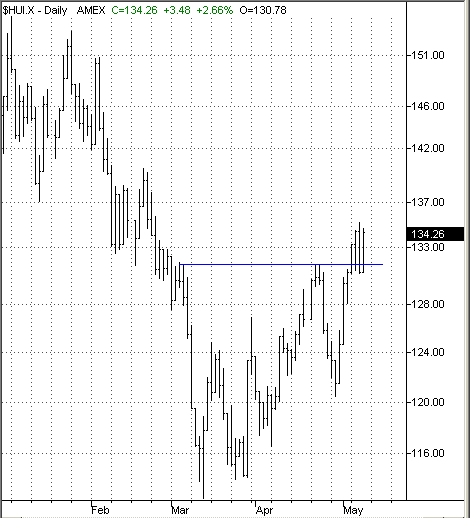
| However, there appear to be occassions when declining prices stop declining and form a consolidation range that has many of the visual characteristics of cup with handles. Whether these patterns are simply bullish head and shoulders bottoms that did not properly develop, or bullish rounding bottom patterns with slight pullbacks on their right sides, or simply prices establishing a higher low after a significant trough, these cup with handle bottoms do seem to occur frequently enough that traders and speculators may benefit from spotting them and monitoring any successful breakout to the upside that may develop. Interestingly, there are two examples of cup with handle bottoms in recent price action--and both of them are found in the common indexes of gold and silver stocks; namely, the Philadelphia Gold and Silver Index ($XAU) and the Basket of Unhedged Gold Stocks (AMEX BUGS) Index ($HUI). |

|
| Figure 1: The $XAU is just on the cusp of a potential breakout from this cup with handle bottom. |
| Graphic provided by: TradeStation. |
| |
| To recap, a cup with handle formation exists when prices make a deep, often scalloped decline, and then rise up to a level near the beginning of the initial decline. This price action forms the "cup" of the cup with handle formation. Prices then find resistance at this point and retreat--though, importantly, the second decline is much smaller in both extent and duration than the initial decline. This forms the "handle." From the second decline, prices then rally up and through the resistance level denoted by the rally, thus completing the cup with handle formation. Generally, prices are expected to rise above the resistance or breakout level by the amount that they had troughed in the initial decline. In other words, adding the formation size to the value at the breakout (a basic application of Stan Weinstein's "swing rule" from his book "Secrets to Profiting in Bull and Bear Markets") gives a good sense of the initial upside from the breakout. Both the $XAU and $HUI bottomed at about the same time as the rest of the stock market in mid-March. However, both indexes also corrected sharply after those rallies began, virtually demolishing all gains from the initial move up. This spike-up/plunge-down price action repeated itself in both indexes at the end of March and beginning of April, before the indexes began climbing strongly into the balance of April. This phase of the advance culminated on April 22nd and 23rd with both indexes testing their March highs. Additionally, this leg of the advance completed the "cup" of the cup with handle consolidation. |
 Figure 2: The $HUI rallies from a test of its May breakout from a cup with handle bottom. The "handle" of the formation came as both indexes moved down and then up again to finish the month of April in price action that was largely reminiscent of the plunge-down/spike-up dynamic that build the "cup" part of the formation. As of this writing, the Philly Gold and Silver index has just broken out above resistance at 70, while the unhedged $HUI stocks have broken out and tested their resistance level at about 132. Should the upsides in both indexes hold, the $XAU could reach 76, while the $HUI could touch 150 before any serious retracement. |
| What is especially noteworthy about the two cup with handle formations in the $XAU and the $HUI is that having benefitted from much of the same price action that has boosted non-gold stocks, it now appears that gold stocks may be poised to continue those gains even as non-gold stocks start to fade. Gold futures bottomed on April 7th and have been in an uptrend ever since. If the cup with handle bottoms in the $XAU and $HUI are valid, then the gold stocks may quite likely benefit from a continued gold rally as well. |
Technical Writer for Technical Analysis of STOCKS & COMMODITIES magazine, Working-Money.com, and Traders.com Advantage.
| Title: | Technical Writer |
| Company: | Technical Analysis, Inc. |
| Address: | 4757 California Avenue SW |
| Seattle, WA 98116 | |
| Phone # for sales: | 206 938 0570 |
| Fax: | 206 938 1307 |
| Website: | www.Traders.com |
| E-mail address: | DPenn@traders.com |
Traders' Resource Links | |
| Charting the Stock Market: The Wyckoff Method -- Books | |
| Working-Money.com -- Online Trading Services | |
| Traders.com Advantage -- Online Trading Services | |
| Technical Analysis of Stocks & Commodities -- Publications and Newsletters | |
| Working Money, at Working-Money.com -- Publications and Newsletters | |
| Traders.com Advantage -- Publications and Newsletters | |
| Professional Traders Starter Kit -- Software | |
Click here for more information about our publications!
Comments
Date: 05/13/03Rank: 5Comment:
Date: 05/13/03Rank: 3Comment:

Request Information From Our Sponsors
- StockCharts.com, Inc.
- Candle Patterns
- Candlestick Charting Explained
- Intermarket Technical Analysis
- John Murphy on Chart Analysis
- John Murphy's Chart Pattern Recognition
- John Murphy's Market Message
- MurphyExplainsMarketAnalysis-Intermarket Analysis
- MurphyExplainsMarketAnalysis-Visual Analysis
- StockCharts.com
- Technical Analysis of the Financial Markets
- The Visual Investor
- VectorVest, Inc.
- Executive Premier Workshop
- One-Day Options Course
- OptionsPro
- Retirement Income Workshop
- Sure-Fire Trading Systems (VectorVest, Inc.)
- Trading as a Business Workshop
- VectorVest 7 EOD
- VectorVest 7 RealTime/IntraDay
- VectorVest AutoTester
- VectorVest Educational Services
- VectorVest OnLine
- VectorVest Options Analyzer
- VectorVest ProGraphics v6.0
- VectorVest ProTrader 7
- VectorVest RealTime Derby Tool
- VectorVest Simulator
- VectorVest Variator
- VectorVest Watchdog
