HOT TOPICS LIST
- MACD
- Fibonacci
- RSI
- Gann
- ADXR
- Stochastics
- Volume
- Triangles
- Futures
- Cycles
- Volatility
- ZIGZAG
- MESA
- Retracement
- Aroon
INDICATORS LIST
LIST OF TOPICS
PRINT THIS ARTICLE
by Arthur Hill
After a large symmetrical triangle consolidation, Checkpoint Software broke resistance on expanding volume to usher in a significant trend change.
Position: N/A
Arthur Hill
Arthur Hill is currently editor of TDTrader.com, a website specializing in trading strategies, sector/industry specific breadth stats and overall technical analysis. He passed the Society of Technical Analysts (STA London) diploma exam with distinction is a Certified Financial Technician (CFTe). Prior to TD Trader, he was the Chief Technical Analyst for Stockcharts.com and the main contributor to the ChartSchool.
PRINT THIS ARTICLE
REVERSAL
Checkpoint Completes Reversal
05/08/03 08:02:28 AMby Arthur Hill
After a large symmetrical triangle consolidation, Checkpoint Software broke resistance on expanding volume to usher in a significant trend change.
Position: N/A
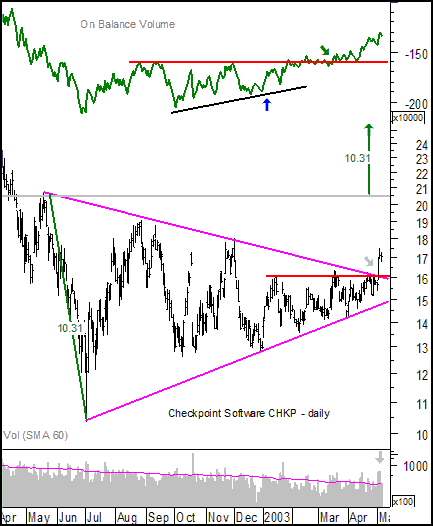
| Symmetrical triangles typically extend one to three months and are considered continuation patterns that form in the middle of a trend. However, large and extended versions can be considered reversal patterns. As with so many patterns, the key is in the break and upside breakouts should be confirmed with expanding volume. |
| After a sharp and extended decline from above 100 to below 15, CHKP finally found support in the second half of 2002 and traced out a large symmetrical triangle. The higher lows reflect buying pressure at higher and higher prices. However, the lower highs counter with selling pressure at lower and lower levels. As the symmetrical triangle extends, something has to give: either a break to the downside and continuation lower or an upside breakout and reversal higher. |

|
| Figure 1: Daily chart for CHKP. |
| Graphic provided by: MetaStock. |
| |
| CHKP broke above the upper trendline of the symmetrical triangle with a sharp move on above average volume. In addition, the stock exceeded its January and March highs. The move is confirmed by strength in On Balance Volume (OBV), which formed a positive divergence in December (blue arrow) and broke resistance in March (green arrow). |
| The breakout is bullish and projects a move to around 31 over the next few months. According to Thomas Bulkowski (Encyclopedia of Chart Patterns), the target is found by subtracting the pattern high from pattern low and adding the difference to the pattern high (20.68 - 10.37 = 10.31, 20.68 + 10.31 = 30.99). In between the current price and the target, resistance is likely around 20. |
Arthur Hill is currently editor of TDTrader.com, a website specializing in trading strategies, sector/industry specific breadth stats and overall technical analysis. He passed the Society of Technical Analysts (STA London) diploma exam with distinction is a Certified Financial Technician (CFTe). Prior to TD Trader, he was the Chief Technical Analyst for Stockcharts.com and the main contributor to the ChartSchool.
| Title: | Editor |
| Company: | TDTrader.com |
| Address: | Willem Geetsstraat 17 |
| Mechelen, B2800 | |
| Phone # for sales: | 3215345465 |
| Website: | www.tdtrader.com |
| E-mail address: | arthurh@tdtrader.com |
Traders' Resource Links | |
| TDTrader.com has not added any product or service information to TRADERS' RESOURCE. | |
Click here for more information about our publications!
Comments
Date: 05/13/03Rank: 4Comment:

|

Request Information From Our Sponsors
- StockCharts.com, Inc.
- Candle Patterns
- Candlestick Charting Explained
- Intermarket Technical Analysis
- John Murphy on Chart Analysis
- John Murphy's Chart Pattern Recognition
- John Murphy's Market Message
- MurphyExplainsMarketAnalysis-Intermarket Analysis
- MurphyExplainsMarketAnalysis-Visual Analysis
- StockCharts.com
- Technical Analysis of the Financial Markets
- The Visual Investor
- VectorVest, Inc.
- Executive Premier Workshop
- One-Day Options Course
- OptionsPro
- Retirement Income Workshop
- Sure-Fire Trading Systems (VectorVest, Inc.)
- Trading as a Business Workshop
- VectorVest 7 EOD
- VectorVest 7 RealTime/IntraDay
- VectorVest AutoTester
- VectorVest Educational Services
- VectorVest OnLine
- VectorVest Options Analyzer
- VectorVest ProGraphics v6.0
- VectorVest ProTrader 7
- VectorVest RealTime Derby Tool
- VectorVest Simulator
- VectorVest Variator
- VectorVest Watchdog
