HOT TOPICS LIST
- MACD
- Fibonacci
- RSI
- Gann
- ADXR
- Stochastics
- Volume
- Triangles
- Futures
- Cycles
- Volatility
- ZIGZAG
- MESA
- Retracement
- Aroon
INDICATORS LIST
LIST OF TOPICS
PRINT THIS ARTICLE
by Matt Blackman
While the market gives mixed signals on whether this is just another bear rally or a real bottom, a number of technology companies are looking downright impressive. Could the techs be trying to lead markets out of the woods?
Position: N/A
Matt Blackman
Matt Blackman is a full-time technical and financial writer and trader. He produces corporate and financial newsletters, and assists clients in getting published in the mainstream media. He is the host of TradeSystemGuru.com. Matt has earned the Chartered Market Technician (CMT) designation. Find out what stocks and futures Matt is watching on Twitter at www.twitter.com/RatioTrade
PRINT THIS ARTICLE
DOUBLE BOTTOMS
Progress Software Looking Solid
05/08/03 11:26:00 AMby Matt Blackman
While the market gives mixed signals on whether this is just another bear rally or a real bottom, a number of technology companies are looking downright impressive. Could the techs be trying to lead markets out of the woods?
Position: N/A
| While other techs experienced major meltdowns in the months following the top of the Nasdaq in 2000, the stock of business management application software developer, Progress Software Corporation (PRGS) has remained quite resilient. It recently gave a double bottom buy signal. A number of other technology and semiconductor companies as evidenced by the SOXX index have also been showing signs of renewed life of late. Could they be trying to lead us into some sort of recovery? That question will only truly be answered with the benefit of hindsight many months from now, but certainly there are indications that this could be the case. |
| Whether you are in the new bull or aging bear camp, PRGS looks like it will do well in either case, at least from the chart perspective. |

|
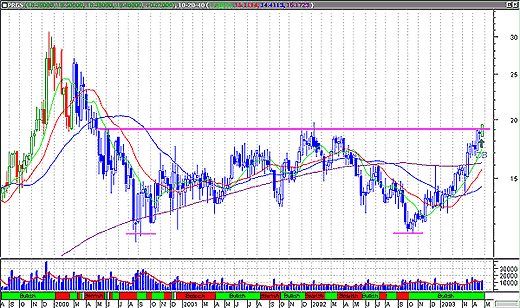
| Figure 1 – The weekly PRGS chart from August 1999 shows a double bottom (DB) chart pattern (outlined in blue) as picked up in a weekly scan using the John Murphy Chart Pattern Recognition plug-in for MetaStock. The neckline sits at $19.10. I have found that weekly scans give more reliable chart patterns signals than daily scans (as pointed out by Mr. Murphy in his books). |
| Graphic provided by: MetaStock. |
| |
| The stock hit a high of $30.75 on December 20, 1999 but unlike the majority of technology related companies, it has come through the recession in pretty good shape. It hit a low (first bottom) of $10.93 in August 2000, rallied somewhat before hitting its second bottom of $11.71 in October 2002. It has been on a tear since and threatened the $20.00 threshold in late April 2003. PRGS fundamentals look solid with earnings consistently coming in above $60 million for the last five quarters, a reasonable trailing 12-month price-to-earnings (P/E) ratio of 31, forward P/E of 27.8 and price-to-book ratio of 3.52 for a software company. Institutions hold 90% of the stock, insiders hold 14% and short interest sits at a relatively attractive level (for longs) at 2.83% of float. |
| To confirm the bullish breakout, technicians will want to see price continue its upward trajectory and hold above the $19.10 neckline on increasing volume; the greater the volume, the more convincing the breakout. We will also need to see this market make up its mind which way it wants to go in the coming days. |
Matt Blackman is a full-time technical and financial writer and trader. He produces corporate and financial newsletters, and assists clients in getting published in the mainstream media. He is the host of TradeSystemGuru.com. Matt has earned the Chartered Market Technician (CMT) designation. Find out what stocks and futures Matt is watching on Twitter at www.twitter.com/RatioTrade
| Company: | TradeSystemGuru.com |
| Address: | Box 2589 |
| Garibaldi Highlands, BC Canada | |
| Phone # for sales: | 604-898-9069 |
| Fax: | 604-898-9069 |
| Website: | www.tradesystemguru.com |
| E-mail address: | indextradermb@gmail.com |
Traders' Resource Links | |
| TradeSystemGuru.com has not added any product or service information to TRADERS' RESOURCE. | |
Click here for more information about our publications!
PRINT THIS ARTICLE

Request Information From Our Sponsors
- StockCharts.com, Inc.
- Candle Patterns
- Candlestick Charting Explained
- Intermarket Technical Analysis
- John Murphy on Chart Analysis
- John Murphy's Chart Pattern Recognition
- John Murphy's Market Message
- MurphyExplainsMarketAnalysis-Intermarket Analysis
- MurphyExplainsMarketAnalysis-Visual Analysis
- StockCharts.com
- Technical Analysis of the Financial Markets
- The Visual Investor
- VectorVest, Inc.
- Executive Premier Workshop
- One-Day Options Course
- OptionsPro
- Retirement Income Workshop
- Sure-Fire Trading Systems (VectorVest, Inc.)
- Trading as a Business Workshop
- VectorVest 7 EOD
- VectorVest 7 RealTime/IntraDay
- VectorVest AutoTester
- VectorVest Educational Services
- VectorVest OnLine
- VectorVest Options Analyzer
- VectorVest ProGraphics v6.0
- VectorVest ProTrader 7
- VectorVest RealTime Derby Tool
- VectorVest Simulator
- VectorVest Variator
- VectorVest Watchdog
