HOT TOPICS LIST
- MACD
- Fibonacci
- RSI
- Gann
- ADXR
- Stochastics
- Volume
- Triangles
- Futures
- Cycles
- Volatility
- ZIGZAG
- MESA
- Retracement
- Aroon
INDICATORS LIST
LIST OF TOPICS
PRINT THIS ARTICLE
by Gary Grosschadl
This volatile tech stock has had a nice recovery after coming down from above $70 to below $50. Now further upside looks tenuous.
Position: Sell
Gary Grosschadl
Independent Canadian equities trader and technical analyst based in Peterborough
Ontario, Canada.
PRINT THIS ARTICLE
CHART ANALYSIS
Electronic Arts (ERTS) Limited Upside
05/06/03 09:25:36 AMby Gary Grosschadl
This volatile tech stock has had a nice recovery after coming down from above $70 to below $50. Now further upside looks tenuous.
Position: Sell
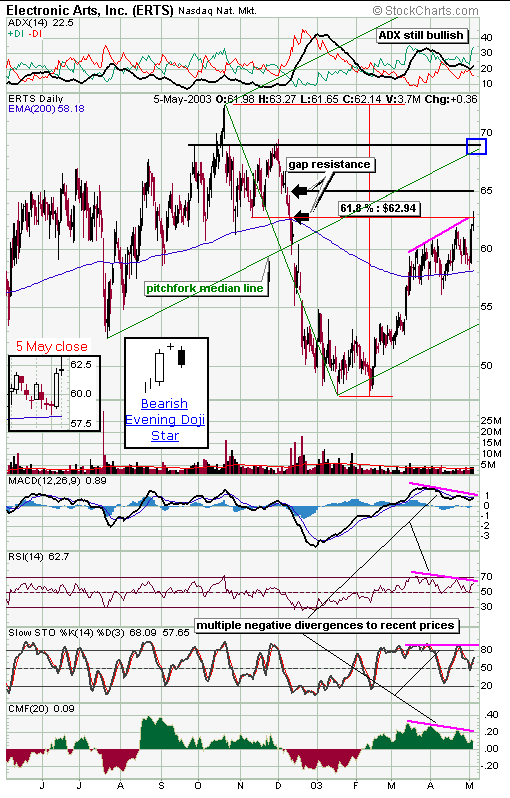
| In the very short-term, note the daily closing pattern - one day away from a candlestick reversal pattern. Monday's doji candlestick, if confirmed today with a down candle becomes a potentially powerful three day reversal pattern called "evening doji star" as illustrated. This could result in challenging the 200-period EMA line again as support at $58.18 as a minimum. Failure here could attract shorting pressure as aggressive traders look for bigger downside possibilities. |
| There are other reasons why the stock is potentially weak. ERTS has reached a commom Fibonacci retracement level. It has retraced by about 61.8 % from its chart high, often a turning point after a good rise. Other factors to consider are a previous gap area (black arrow) at this same point which often can act as upside resistance, and multiple negative divergences to price action on several displayed indicators. Note the bottom indicator CMF is the Chaikin money flow which measures buying pressure. Since, like the other indicators, it supports a possible drop in ERT's price, it adds additional credence from the perspective of supply and demand. |

|
| ERTS daily chart |
| Graphic provided by: StockCharts.com. |
| |
| This is not to say there are no upside possibilities. If the stock powers above this warning doji, it negates the bearish implication and further upside targets should be considered. Should an upside surprise occur, note two target areas: another previous gap area at $65 and then $70 area which relates to previous candle resistance, and the median line of the green pitchfork. Typically a strong move can result in a test of median line resistance. Also the uppermost indicator ADX/DI (also called DMI as in directional movement indicator) still shows a bullish setup with ADX in between the DIs. |
| In summary ERTS looks vulnerable to some downside action which may lead to a test of 200-period EMA support. Failure there has further downside implications. Watch the action the next few days to see which way confirmation goes in case an upside surprise takes them the other way. |
Independent Canadian equities trader and technical analyst based in Peterborough
Ontario, Canada.
| Website: | www.whatsonsale.ca/financial.html |
| E-mail address: | gwg7@sympatico.ca |
Click here for more information about our publications!
Comments

Request Information From Our Sponsors
- StockCharts.com, Inc.
- Candle Patterns
- Candlestick Charting Explained
- Intermarket Technical Analysis
- John Murphy on Chart Analysis
- John Murphy's Chart Pattern Recognition
- John Murphy's Market Message
- MurphyExplainsMarketAnalysis-Intermarket Analysis
- MurphyExplainsMarketAnalysis-Visual Analysis
- StockCharts.com
- Technical Analysis of the Financial Markets
- The Visual Investor
- VectorVest, Inc.
- Executive Premier Workshop
- One-Day Options Course
- OptionsPro
- Retirement Income Workshop
- Sure-Fire Trading Systems (VectorVest, Inc.)
- Trading as a Business Workshop
- VectorVest 7 EOD
- VectorVest 7 RealTime/IntraDay
- VectorVest AutoTester
- VectorVest Educational Services
- VectorVest OnLine
- VectorVest Options Analyzer
- VectorVest ProGraphics v6.0
- VectorVest ProTrader 7
- VectorVest RealTime Derby Tool
- VectorVest Simulator
- VectorVest Variator
- VectorVest Watchdog
