HOT TOPICS LIST
- MACD
- Fibonacci
- RSI
- Gann
- ADXR
- Stochastics
- Volume
- Triangles
- Futures
- Cycles
- Volatility
- ZIGZAG
- MESA
- Retracement
- Aroon
INDICATORS LIST
LIST OF TOPICS
PRINT THIS ARTICLE
by Koos van der Merwe
Xerox is a name that is synonymous with photocopying, in fact today one talks of "xeroxing" a document as opposed to photocopying a document. And yet the company fell on hard times and the share crashed. Is it making a comeback?
Position: Accumulate
Koos van der Merwe
Has been a technical analyst since 1969, and has worked as a futures and options trader with First Financial Futures in Johannesburg, South Africa.
PRINT THIS ARTICLE
ELLIOTT WAVE
Xerox - Is it Making a Comeback?
05/06/03 11:53:10 AMby Koos van der Merwe
Xerox is a name that is synonymous with photocopying, in fact today one talks of "xeroxing" a document as opposed to photocopying a document. And yet the company fell on hard times and the share crashed. Is it making a comeback?
Position: Accumulate
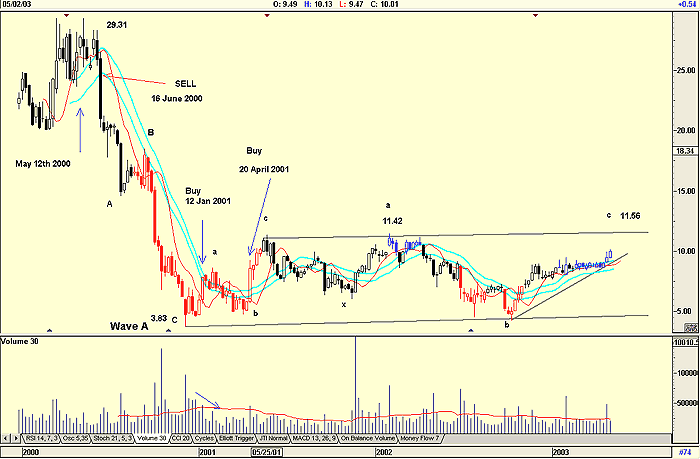
| The weekly chart of Xerox (XRX) shows the company topping out at $29.31 on May 12th, 2000, the height of the bubble. As details of auditing and other problems in the company became known, the share price dropped alarmingly to reach a low of $3.83 in December of 2000, a drop of 87%. The JM sell signal came on the May 12, 2000 at $24.38. |
| To recap, a JM inside trading band is a 15-period moving average offset by 2% in either direction. This percentage can vary depending on the stock and whether it is a daily or weekly chart. The idea is to change the percentages so that not too many buy or sell signals are given. In the first chart, the JM band is a 15-week moving average offset by 4% upwards and -4% downwards. |

|
| Figure 1: Xerox weekly chart. |
| Graphic provided by: AdvancedGET. |
| |
| On January 12, 2001, the share gave a JM buy signal. But this was on falling volume, which was suspect, and the share price then fell back, breaking below the lower JM band line with below average volume. It then made a double bottom, and broke upward on the 20th of April, giving a JM buy signal by breaking above the upper JM band line on a volume spike, which soon petered out. Since then the price on the weekly chart suggests that it is trading within a parallelogram between $5.00 and $11.42, continually flirting with the JM band line -- a pattern good for traders. However, looking closely at the weekly chart, you will see the following. The fall from May 12th looks like an Elliott wave ABC pattern. Normally I never include Elliott in a trading strategy, as I firmly believe that you cannot trade successfully all the time using only Elliott. Something else, another indicator, must be used in conjunction with it. However, Elliott is brilliant in telling one where the market is, and I believe (and the Xerox chart pattern is another nail in the long-term coffin), that the Dow/Nasdaq is in a B-Wave up with about two years to go. From this perspective profits can be made. So I feel that Xerox has completed Wave A down, is now in Wave B up by way of and abcxabcxabcx (ad infintum) up. Where it ends? Could be anywhere. I have known B-Waves to exceed Wave 5. This means that any move up should be in a five wave impulse pattern. The move to 11.42 does not look like an impulse pattern so it must be an abcx pattern, meaning the abc down culminated in a finalization of Wave A, with the present movement being a Wave B up move. The parallelogram will follow the abcxabc pattern as shown and should rise to test the resistance level at $11.56 "1c." Never forget though, that B-Waves are very volatile, and targets are difficult to predict. |
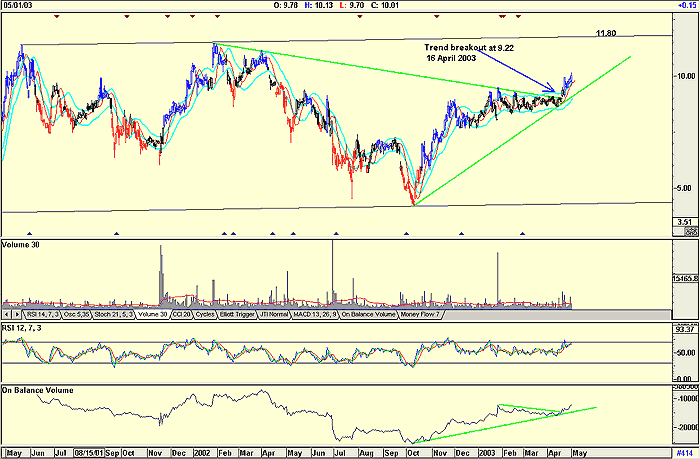
Now look at the daily chart, and see what this tells us. Figure 2: Daily chart of IBM. |
| In the chart you can see the parallelogram lines of the weekly chart at the top and bottom of the range (gray lines). However I have also drawn in support and resistance line of the recent and present trend. The chart shows how Xerox broke its downtrend resistance line, and incidentally broke above the JM upper band line at $9.22 on April 16, 2003. Volume rose on the initial breakout, but then fell back, only to strengthen again as the price moved higher. The on balance volume indicator in the chart shows that the trend is up, although the RSI indicator, and I have used a 12-period RSI, is suggesting that the price could rise to 11.80 when it would become overbought. I would buy the share at this price, keeping the resistance of $11.80 in mind. Any break above this resistance line, could see it rise to $15, the level of "1A" as seen on the weekly chart. |
Has been a technical analyst since 1969, and has worked as a futures and options trader with First Financial Futures in Johannesburg, South Africa.
| Address: | 3256 West 24th Ave |
| Vancouver, BC | |
| Phone # for sales: | 6042634214 |
| E-mail address: | petroosp@gmail.com |
Click here for more information about our publications!
PRINT THIS ARTICLE

Request Information From Our Sponsors
- StockCharts.com, Inc.
- Candle Patterns
- Candlestick Charting Explained
- Intermarket Technical Analysis
- John Murphy on Chart Analysis
- John Murphy's Chart Pattern Recognition
- John Murphy's Market Message
- MurphyExplainsMarketAnalysis-Intermarket Analysis
- MurphyExplainsMarketAnalysis-Visual Analysis
- StockCharts.com
- Technical Analysis of the Financial Markets
- The Visual Investor
- VectorVest, Inc.
- Executive Premier Workshop
- One-Day Options Course
- OptionsPro
- Retirement Income Workshop
- Sure-Fire Trading Systems (VectorVest, Inc.)
- Trading as a Business Workshop
- VectorVest 7 EOD
- VectorVest 7 RealTime/IntraDay
- VectorVest AutoTester
- VectorVest Educational Services
- VectorVest OnLine
- VectorVest Options Analyzer
- VectorVest ProGraphics v6.0
- VectorVest ProTrader 7
- VectorVest RealTime Derby Tool
- VectorVest Simulator
- VectorVest Variator
- VectorVest Watchdog
