HOT TOPICS LIST
- MACD
- Fibonacci
- RSI
- Gann
- ADXR
- Stochastics
- Volume
- Triangles
- Futures
- Cycles
- Volatility
- ZIGZAG
- MESA
- Retracement
- Aroon
INDICATORS LIST
LIST OF TOPICS
PRINT THIS ARTICLE
by David Penn
Does failure to follow-through on the April 29th highs mean the Nasdaq is finally headed lower?
Position: N/A
David Penn
Technical Writer for Technical Analysis of STOCKS & COMMODITIES magazine, Working-Money.com, and Traders.com Advantage.
PRINT THIS ARTICLE
REVERSAL
The Nasdaq's 2B Test of Top
05/02/03 09:40:13 AMby David Penn
Does failure to follow-through on the April 29th highs mean the Nasdaq is finally headed lower?
Position: N/A
| Those most bullish about the US equities market have been most bullish about the Nasdaq. This is not without good reason; up some 8% on the year, the Nasdaq is up more than twice that off the mid-March lows. This is perhaps especially inspiring for those who believe that yesterday's equity market leaders will also be the leaders of tomorrow--a dubious, if understandable, conviction. |
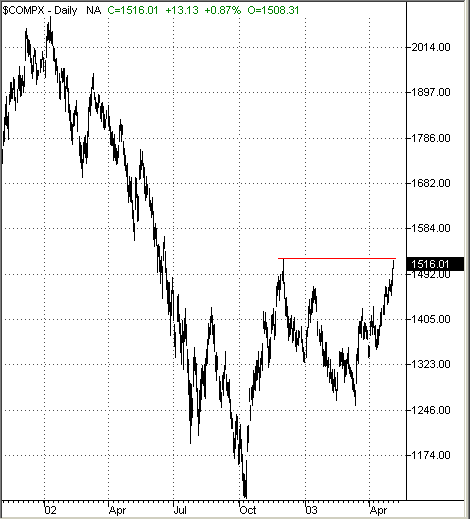
| However, the Nasdaq is approaching an important juncture having bested the highs of the year set back in at the beginning of January. If the Nasdaq is to truly turn around and embark upon a sustainable bull market even of the multiple-month, cyclical varietythen it will need to survive a test of the December 2, 2002 highs at 1521. And while the uptrend line from the mid-March lows remains intact (albeit steepening at an alarming rate), the Nasdaq must successfully close above 1521 and produce meaningful follow-through to the upside or risk the sort of failure that could see "yesterday's equity market leaders" returning to the days of deep correction. |

|
| Figure 1: Will the Nasdaq survive a major 2B test of top? |
| Graphic provided by: TradeStation. |
| |
| To refresh, a 2B test of top occurs when prices rally to a new high, retreat and then rally to establish an even higher high. This sets up the test. If the higher high is the harbinger of continued advances, then there should be follow-through price action to the upside--perhaps even a gap up above the previous high. However, if the higher high was little more than what is referred to as a "bull trap," then prices often will retreat from the higher high, sometimes drifting lower slowly at first, sometimes plunging sharply from the challenge of surpassing the new higher high. |
| Writing in his "Methods of a Wall Street Master," trader Vic Sperandeo (from whom the 2B test originates) notes that "a 2B on a minor high or low will usually occur within one day or less of the time the high or low is made. For 2B's on intermediate highs or lows preceding a correction, the new high or low point will usually break within three to five days." If Sperandeo's assessment is correct, then the next few days will prove pivotal to the possibility of continued advances in the Nasdaq's more-than-a-month-old rally. |
Technical Writer for Technical Analysis of STOCKS & COMMODITIES magazine, Working-Money.com, and Traders.com Advantage.
| Title: | Technical Writer |
| Company: | Technical Analysis, Inc. |
| Address: | 4757 California Avenue SW |
| Seattle, WA 98116 | |
| Phone # for sales: | 206 938 0570 |
| Fax: | 206 938 1307 |
| Website: | www.Traders.com |
| E-mail address: | DPenn@traders.com |
Traders' Resource Links | |
| Charting the Stock Market: The Wyckoff Method -- Books | |
| Working-Money.com -- Online Trading Services | |
| Traders.com Advantage -- Online Trading Services | |
| Technical Analysis of Stocks & Commodities -- Publications and Newsletters | |
| Working Money, at Working-Money.com -- Publications and Newsletters | |
| Traders.com Advantage -- Publications and Newsletters | |
| Professional Traders Starter Kit -- Software | |
Click here for more information about our publications!
Comments
Date: 05/06/03Rank: 5Comment:
Date: 05/06/03Rank: 4Comment:
Date: 05/06/03Rank: 5Comment:

Request Information From Our Sponsors
- StockCharts.com, Inc.
- Candle Patterns
- Candlestick Charting Explained
- Intermarket Technical Analysis
- John Murphy on Chart Analysis
- John Murphy's Chart Pattern Recognition
- John Murphy's Market Message
- MurphyExplainsMarketAnalysis-Intermarket Analysis
- MurphyExplainsMarketAnalysis-Visual Analysis
- StockCharts.com
- Technical Analysis of the Financial Markets
- The Visual Investor
- VectorVest, Inc.
- Executive Premier Workshop
- One-Day Options Course
- OptionsPro
- Retirement Income Workshop
- Sure-Fire Trading Systems (VectorVest, Inc.)
- Trading as a Business Workshop
- VectorVest 7 EOD
- VectorVest 7 RealTime/IntraDay
- VectorVest AutoTester
- VectorVest Educational Services
- VectorVest OnLine
- VectorVest Options Analyzer
- VectorVest ProGraphics v6.0
- VectorVest ProTrader 7
- VectorVest RealTime Derby Tool
- VectorVest Simulator
- VectorVest Variator
- VectorVest Watchdog
