HOT TOPICS LIST
- MACD
- Fibonacci
- RSI
- Gann
- ADXR
- Stochastics
- Volume
- Triangles
- Futures
- Cycles
- Volatility
- ZIGZAG
- MESA
- Retracement
- Aroon
INDICATORS LIST
LIST OF TOPICS
PRINT THIS ARTICLE
by Gary Grosschadl
IBM's weekly chart shows a likely trading range and if so, the upside is limited.
Position: N/A
Gary Grosschadl
Independent Canadian equities trader and technical analyst based in Peterborough
Ontario, Canada.
PRINT THIS ARTICLE
CHART ANALYSIS
IBM In a Trading Channel
05/05/03 01:59:03 PMby Gary Grosschadl
IBM's weekly chart shows a likely trading range and if so, the upside is limited.
Position: N/A
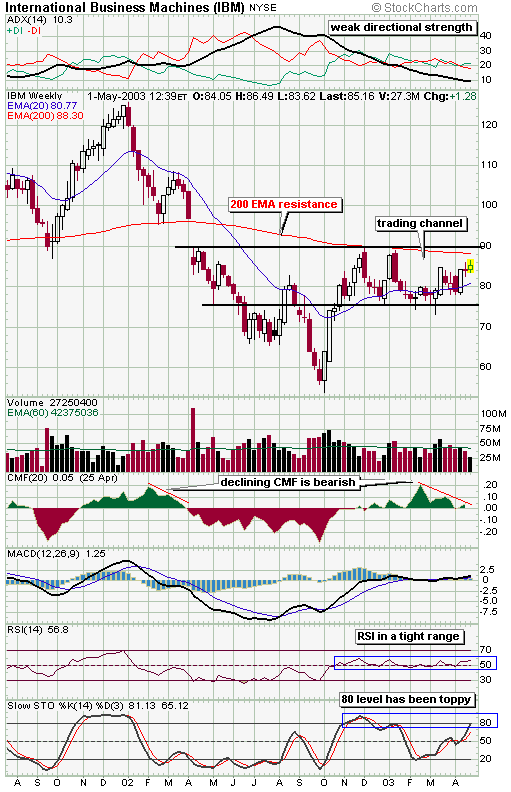
| The weekly chart shows formidable gap resistance at $90. This is even more compelling when the 200-week EMA is also nearby and has been shown "respect" twice before. Currently it is at $88.30. From last November, a case could be made that IBM is in a trading range between $90 and $76. Buying near the bottom of that range and selling near the top can be a possible strategy. |
| Besides the obvious channel, two indicators add weight to the trading range. At the top of the chart, the DMI or directional movement index (composed of ADX/DIs) is showing weak directional strength. When the ADX line plunges below 20, as in this case, it can signal a change from a trending market to a non-trending market or in other words a shift to a trading range. In a similar way the RSI or relative strength index is saying the same thing as it stays in a tight range around the 50 level. A decisive move through this 50 level in either direction often signals a sizeable move but here I see no commitment out of this tight band. |

|
| IBM weekly chart. |
| Graphic provided by: StockCharts.com. |
| |
| The CMF or Chaiken money flow oscillator is also noteworthy. It is in a bearish declining trend as the stock has been moving towards the top of the channel. This hints at another failure at this upper range. The last time the CMF showed such a profile was in early 2002, and the stock had a serious downleg soon after. Although in this case the move is more likely to be to the channel's lower limit. |
| When stocks are in a trading range, oscillators such as stochastics can be good timing indicators. Generally a move down from the 80 level (overbought territory) is a sell signal while a move up from 20 (oversold territory) often gives a good buy signal. From this weekly chart the stochastics has just reached the 80 level so the next reversal may not be far away especially with the 200-period EMA so close. Likewise if a downleg ensues, watch for a stochastic reversal near the lower trendline for yet another possible ride back up the channel. A close above or below the channel negates the trading range. |
Independent Canadian equities trader and technical analyst based in Peterborough
Ontario, Canada.
| Website: | www.whatsonsale.ca/financial.html |
| E-mail address: | gwg7@sympatico.ca |
Click here for more information about our publications!
Comments
Date: 05/07/03Rank: 4Comment:

Request Information From Our Sponsors
- StockCharts.com, Inc.
- Candle Patterns
- Candlestick Charting Explained
- Intermarket Technical Analysis
- John Murphy on Chart Analysis
- John Murphy's Chart Pattern Recognition
- John Murphy's Market Message
- MurphyExplainsMarketAnalysis-Intermarket Analysis
- MurphyExplainsMarketAnalysis-Visual Analysis
- StockCharts.com
- Technical Analysis of the Financial Markets
- The Visual Investor
- VectorVest, Inc.
- Executive Premier Workshop
- One-Day Options Course
- OptionsPro
- Retirement Income Workshop
- Sure-Fire Trading Systems (VectorVest, Inc.)
- Trading as a Business Workshop
- VectorVest 7 EOD
- VectorVest 7 RealTime/IntraDay
- VectorVest AutoTester
- VectorVest Educational Services
- VectorVest OnLine
- VectorVest Options Analyzer
- VectorVest ProGraphics v6.0
- VectorVest ProTrader 7
- VectorVest RealTime Derby Tool
- VectorVest Simulator
- VectorVest Variator
- VectorVest Watchdog
