HOT TOPICS LIST
- MACD
- Fibonacci
- RSI
- Gann
- ADXR
- Stochastics
- Volume
- Triangles
- Futures
- Cycles
- Volatility
- ZIGZAG
- MESA
- Retracement
- Aroon
INDICATORS LIST
LIST OF TOPICS
PRINT THIS ARTICLE
by David Penn
Now that they've broken out, how far will they move up?
Position: N/A
David Penn
Technical Writer for Technical Analysis of STOCKS & COMMODITIES magazine, Working-Money.com, and Traders.com Advantage.
PRINT THIS ARTICLE
TRIANGLES
The Triangle Breakout in Beans
05/02/03 08:07:43 AMby David Penn
Now that they've broken out, how far will they move up?
Position: N/A
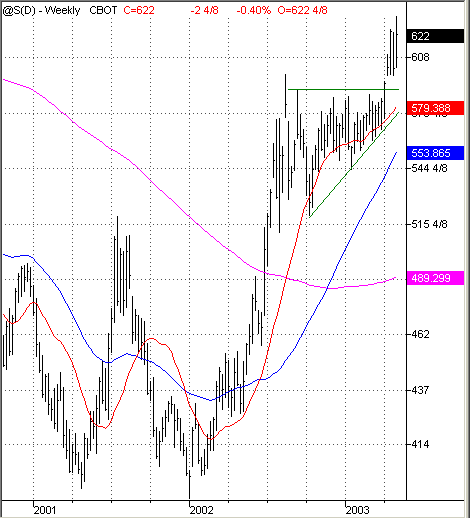
| Back in February, I suggested that while wheat and corn were in an agonizing bottoming process, soybeans were not only ascendant, but also appeared to be on the verge of breaking free from a consolidation that had taken on the form of an ascending triangle. Most evident on a weekly chart of continuous futures, soybeans have been trending upward since the beginning of 2002 when they were priced at about 401. Peaking in August at 598, soybeans then slipped into a consolidation range that lasted from the late summer of 2002 until April 2003, when they broke out of the consolidation in fairly dramatic fashion. |
| The August 2002-April 2003 consolidation, as I mentioned, took on the form of an ascending triangle, with its horizontal resistance at the top and an upwardly sloping support trendline below. On the charts of some contract months, particularly daily charts of contracts such as July, soybeans appear to have made a premature breakout in late February. But the longer-term view shows a clear break from the triangle consolidation before prices reach the convergence point of the horizontal and upwardly sloping trendlines. |

|
| Figure 1: Post-breakout, soybeans struggle to maintain higher ground. |
| Graphic provided by: TradeStation. |
| |
| The measurement rule for ascending triangles subtracts the value from the lowest point in the formation from the value at the horizontal resistance line, and then adds that amount to the value at resistance. In the case of soybean continuous futures shown here, a formation size of about 69 added to a resistance level of about 589 gives a minimum ascending triangle breakout upside target of about 658, some 36 points from soybeans' current levels. |
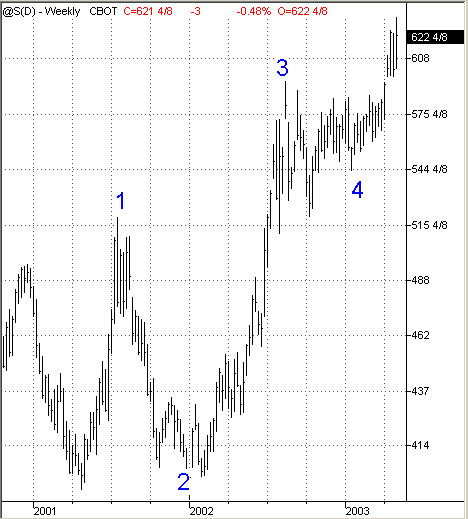
However, there could be even more upside in store for soybeans, particularly if a Fibonacci projection from soybeans first leg up is taken into account. In this instance, I am applying an Elliott wave count to soybean futures that looks as follows: |
| Using the methods described by Robert Fischer (see his book "Fibonacci Applications and Strategies for Traders" or my Traders.com Advantage piece, "Fibonacci and Fifth Waves," February 11, 2003), a wave 5 peak can be projected somewhere around 720. This projection is based on an average of the two projections provided by waves 1 and 3. In short, by multiplying the length of wave 1 times 1.618 and adding that number to the value at the top of wave 1, we get one projection of a wave 5 peak. To get another projection of a possible wave 5 peak, I multiply the length of wave 3 times 0.618 and add that number to the value at the top of wave 3. The two projections are 718.26 and 722.68, respectively, thus pointing to likely follow-through to the upside in soybeans over the coming months. |
Technical Writer for Technical Analysis of STOCKS & COMMODITIES magazine, Working-Money.com, and Traders.com Advantage.
| Title: | Technical Writer |
| Company: | Technical Analysis, Inc. |
| Address: | 4757 California Avenue SW |
| Seattle, WA 98116 | |
| Phone # for sales: | 206 938 0570 |
| Fax: | 206 938 1307 |
| Website: | www.Traders.com |
| E-mail address: | DPenn@traders.com |
Traders' Resource Links | |
| Charting the Stock Market: The Wyckoff Method -- Books | |
| Working-Money.com -- Online Trading Services | |
| Traders.com Advantage -- Online Trading Services | |
| Technical Analysis of Stocks & Commodities -- Publications and Newsletters | |
| Working Money, at Working-Money.com -- Publications and Newsletters | |
| Traders.com Advantage -- Publications and Newsletters | |
| Professional Traders Starter Kit -- Software | |
Click here for more information about our publications!
Comments
Date: 05/06/03Rank: 4Comment:
Date: 05/13/03Rank: 4Comment: nice followup

Request Information From Our Sponsors
- VectorVest, Inc.
- Executive Premier Workshop
- One-Day Options Course
- OptionsPro
- Retirement Income Workshop
- Sure-Fire Trading Systems (VectorVest, Inc.)
- Trading as a Business Workshop
- VectorVest 7 EOD
- VectorVest 7 RealTime/IntraDay
- VectorVest AutoTester
- VectorVest Educational Services
- VectorVest OnLine
- VectorVest Options Analyzer
- VectorVest ProGraphics v6.0
- VectorVest ProTrader 7
- VectorVest RealTime Derby Tool
- VectorVest Simulator
- VectorVest Variator
- VectorVest Watchdog
- StockCharts.com, Inc.
- Candle Patterns
- Candlestick Charting Explained
- Intermarket Technical Analysis
- John Murphy on Chart Analysis
- John Murphy's Chart Pattern Recognition
- John Murphy's Market Message
- MurphyExplainsMarketAnalysis-Intermarket Analysis
- MurphyExplainsMarketAnalysis-Visual Analysis
- StockCharts.com
- Technical Analysis of the Financial Markets
- The Visual Investor
