HOT TOPICS LIST
- MACD
- Fibonacci
- RSI
- Gann
- ADXR
- Stochastics
- Volume
- Triangles
- Futures
- Cycles
- Volatility
- ZIGZAG
- MESA
- Retracement
- Aroon
INDICATORS LIST
LIST OF TOPICS
PRINT THIS ARTICLE
by Koos van der Merwe
Applying the Red/Green strategy to a stock in a trading range.
Position: Buy
Koos van der Merwe
Has been a technical analyst since 1969, and has worked as a futures and options trader with First Financial Futures in Johannesburg, South Africa.
PRINT THIS ARTICLE
MOVING AVERAGES
Mirant Corporation
05/08/03 08:11:18 AMby Koos van der Merwe
Applying the Red/Green strategy to a stock in a trading range.
Position: Buy
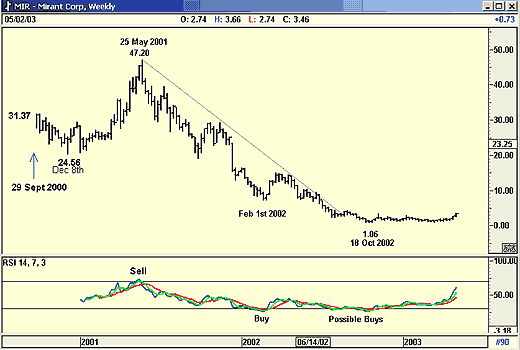
| Mirant Corporation (MIR) is a leading, global competitive-energy company. They deliver value by integrating an extensive portfolio of power and natural gas assets with risk management and marketing expertise. A recent news release on the company stated: ATLANTA, April 30 /PRNewswire-FirstCall/ -- Mirant (NYSE: MIR) today announced that it has completed the annual audit of the company's 2002 financials, and the re-audits of its 2001 and 2000 financials. Mirant reported a $2.4 billion net loss for 2002, or a loss of $6.06 per share. This compares to $409 million in restated net income for 2001, or $1.19 per diluted share. ...And yet the share price is rising? Let us see what the charts are saying about the company.  Figure 1: American Express daily chart. The weekly chart above shows that the share came to the market on September 29, 2000 at $31.37. After falling to $24.56 by December, it started rising strongly to reach a high of $47.20 by May 21, 2001. Since then it has been steadily falling, and appears to have bottomed in October 2002 at $1.06, trading relatively flat since then, as seen on the weekly chart. |
| The RSI indicator does show a sell signal on May 21st when it reached its high of $47.20, then gave a buy signal. The signal failed on Feb 1st, 2002. It fell away and its RSI signal followed the price down, to remain below the 30 level, occasionally suggesting interest by rising above the 30 level, now and again, but offering nothing conclusive. Then as 2003 approached the RSI started rising, with the price rising ever so slightly but still was not tempting as seen on the weekly chart, although it could have been argued that the long-term downtrend line had been broken, and a bullish long-term saucer pattern could have been developing. But it was not decisive enough to catch my attention. And yet the share caught my attention. Why? To get a better picture of what was happening, I looked at the daily chart. |

|
| MIRANT CORPORATION |
| Graphic provided by: AdvancedGET. |
| |
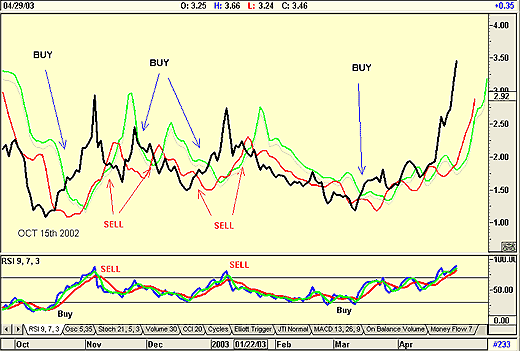
| In the chart above, you will see that I use the RED-GREEN Buy/Sell strategy. To recap, you prepare a two or three day moving average of the high of the daily price and offset it forward by 10 days. This is your buy level (green line). You prepare a two or three day moving average of the low of the daily price, and offset it forward by six days. This is your sell level (red line). |
| You buy the share when the closing price breaks above the green line, and you sell when the close breaks below the red line. I have found that confirmation by an RSI, (in the above a 9-RSI) does help in the final decision. The above chart is self-explanatory. You can see where the RSI gave an early buy signal at the end of February 2003 that was not confirmed by a price break above the green buy line. Confirmation only occurred at the second buy signal in early March. Do notice that in April, the closing price did break below the green-buy line, but did not give a sell signal by breaking below the red-sell line. The question is, is there any way you could have identified MIR as a stock to watch? To do so, you would need a system that filters through your entire stock database and identifies stocks that meet certain parameters. One such system could be to identify new highs, over the last x number of days, or stocks that have gapped on the previous day's closing. Whatever strategy you use, you would have had to identify MIR, and then decided whether to buy it or not. Above is a simple strategy to help you in that important decision. |
Has been a technical analyst since 1969, and has worked as a futures and options trader with First Financial Futures in Johannesburg, South Africa.
| Address: | 3256 West 24th Ave |
| Vancouver, BC | |
| Phone # for sales: | 6042634214 |
| E-mail address: | petroosp@gmail.com |
Click here for more information about our publications!
PRINT THIS ARTICLE

Request Information From Our Sponsors
- StockCharts.com, Inc.
- Candle Patterns
- Candlestick Charting Explained
- Intermarket Technical Analysis
- John Murphy on Chart Analysis
- John Murphy's Chart Pattern Recognition
- John Murphy's Market Message
- MurphyExplainsMarketAnalysis-Intermarket Analysis
- MurphyExplainsMarketAnalysis-Visual Analysis
- StockCharts.com
- Technical Analysis of the Financial Markets
- The Visual Investor
- VectorVest, Inc.
- Executive Premier Workshop
- One-Day Options Course
- OptionsPro
- Retirement Income Workshop
- Sure-Fire Trading Systems (VectorVest, Inc.)
- Trading as a Business Workshop
- VectorVest 7 EOD
- VectorVest 7 RealTime/IntraDay
- VectorVest AutoTester
- VectorVest Educational Services
- VectorVest OnLine
- VectorVest Options Analyzer
- VectorVest ProGraphics v6.0
- VectorVest ProTrader 7
- VectorVest RealTime Derby Tool
- VectorVest Simulator
- VectorVest Variator
- VectorVest Watchdog
