HOT TOPICS LIST
- MACD
- Fibonacci
- RSI
- Gann
- ADXR
- Stochastics
- Volume
- Triangles
- Futures
- Cycles
- Volatility
- ZIGZAG
- MESA
- Retracement
- Aroon
INDICATORS LIST
LIST OF TOPICS
PRINT THIS ARTICLE
by Gary Grosschadl
As their daily charts move above their 200-day moving averages, the indices are showing a short-term trend change.
What are the weekly charts showing with their longer-term views?
Position: N/A
Gary Grosschadl
Independent Canadian equities trader and technical analyst based in Peterborough
Ontario, Canada.
PRINT THIS ARTICLE
CHART ANALYSIS
The Nasdaq Leading the Race to Weekly Trend Change
05/01/03 12:05:26 PMby Gary Grosschadl
As their daily charts move above their 200-day moving averages, the indices are showing a short-term trend change.
What are the weekly charts showing with their longer-term views?
Position: N/A
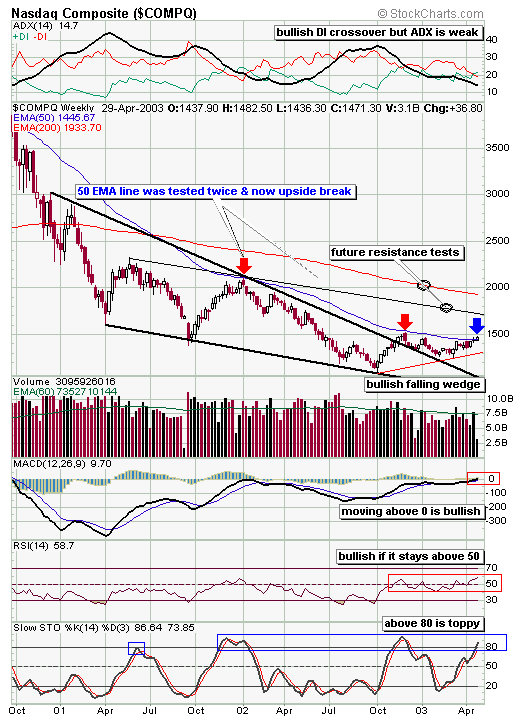
| After looking at various indices, the Nasdaq Composite is winning the race to a weekly trend change via a break (so far) above its 50-week EMA or exponential moving average. I often prefer the exponential to the simple moving averages but the acid test is how well they are respected on the charts. The exponential moving averages have more weight assigned to recent fluctuations. Sometimes there is very little difference between them but with volatile action you usually see a greater disparity. For clarity's sake I did not include the 50-week SMA on my weekly chart, but it has been violated before and so does not command as much "respect" as the EMA. |
| There is supporting evidence for this premise of longer-term trend change. The index has broken out of a bullish falling wedge although not in a convincing way with a sideways drift. Nevertheless it has not gone back inside the wedge. This sideways action is no surprise when you consider the plunging ADX line (topmost indicator). This indicates weak directional movement until the ADX line reverses and heads north, ideally above 20. The MACD line (moving average convergence/divergence) is starting to move above zero and needs to keep rising past this potential stall point. The RSI (relative strength index) is trying again to make a move beyond 50. Stochastics is above 80 and getting toppy. However since this is a weekly chart, it could take several weeks to break down below 80 again so there is some upside room. |

|
| Nasdaq weekly chart. |
| Graphic provided by: StockcCharts.com. |
| |
| Note the small red trendline near the bottom of the chart. This suggests further evidence of a trend change. A higher low has been established going on seven weeks since the trendline touch. If this is soon followed by a higher high, then this is the hallmark of a trend change. Ideally this trendline should not be broken to keep the bullish scenario intact. |
| Since this is a weekly chart, Friday's close will be more significant. This index needs to close above the 50-week EMA (currently 1445) to show continued upward momentum and provide some evidence of longer-term trend change. Note the two upside tests coming, the first at 1700 being a higher trendline. |
Independent Canadian equities trader and technical analyst based in Peterborough
Ontario, Canada.
| Website: | www.whatsonsale.ca/financial.html |
| E-mail address: | gwg7@sympatico.ca |
Click here for more information about our publications!
Comments
Date: 05/01/03Rank: 4Comment:
Date: 05/02/03Rank: 5Comment:

Request Information From Our Sponsors
- StockCharts.com, Inc.
- Candle Patterns
- Candlestick Charting Explained
- Intermarket Technical Analysis
- John Murphy on Chart Analysis
- John Murphy's Chart Pattern Recognition
- John Murphy's Market Message
- MurphyExplainsMarketAnalysis-Intermarket Analysis
- MurphyExplainsMarketAnalysis-Visual Analysis
- StockCharts.com
- Technical Analysis of the Financial Markets
- The Visual Investor
- VectorVest, Inc.
- Executive Premier Workshop
- One-Day Options Course
- OptionsPro
- Retirement Income Workshop
- Sure-Fire Trading Systems (VectorVest, Inc.)
- Trading as a Business Workshop
- VectorVest 7 EOD
- VectorVest 7 RealTime/IntraDay
- VectorVest AutoTester
- VectorVest Educational Services
- VectorVest OnLine
- VectorVest Options Analyzer
- VectorVest ProGraphics v6.0
- VectorVest ProTrader 7
- VectorVest RealTime Derby Tool
- VectorVest Simulator
- VectorVest Variator
- VectorVest Watchdog
