HOT TOPICS LIST
- MACD
- Fibonacci
- RSI
- Gann
- ADXR
- Stochastics
- Volume
- Triangles
- Futures
- Cycles
- Volatility
- ZIGZAG
- MESA
- Retracement
- Aroon
INDICATORS LIST
LIST OF TOPICS
PRINT THIS ARTICLE
by Koos van der Merwe
XLK is an exchange traded fund found on the AMEX. ETFs are index mutual funds that can be bought and sold just like common stock and are traded on the American Stock Exchange along with Standard & Poor's depositary receipts (SPDRs). XLK is a technology index fund very similar to the QQQs. The volume traded is a lot smaller with a price just about half that of the QQQs. Can it be traded as a poor man's QQQs?
Position: Buy
Koos van der Merwe
Has been a technical analyst since 1969, and has worked as a futures and options trader with First Financial Futures in Johannesburg, South Africa.
PRINT THIS ARTICLE
CORRELATION ANALYSIS
QQQs and the SPDR Technology Index ETF
04/29/03 11:27:56 AMby Koos van der Merwe
XLK is an exchange traded fund found on the AMEX. ETFs are index mutual funds that can be bought and sold just like common stock and are traded on the American Stock Exchange along with Standard & Poor's depositary receipts (SPDRs). XLK is a technology index fund very similar to the QQQs. The volume traded is a lot smaller with a price just about half that of the QQQs. Can it be traded as a poor man's QQQs?
Position: Buy
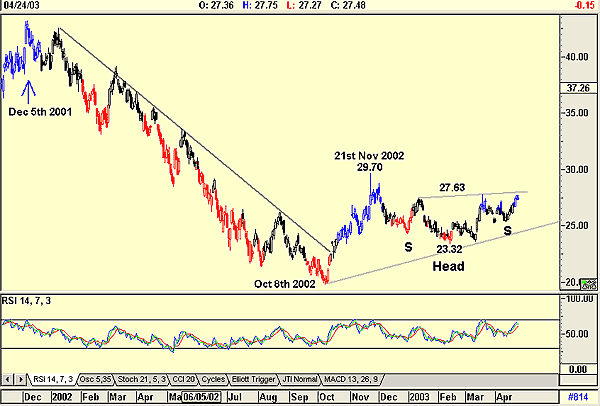
 Figure 1: Chart of the QQQs. Notice on the above chart how the price of the QQQs moved down from a high on December 5th, 2001 to a low on October 8th. It then moved up to 29.58 on November 20 before falling back to 23.32 in February, 2003. It is now tracing an inverse head and shoulder pattern with a neckline at 23.63 and a target, should it break above the neckline, of 31.94. (Target calculations: 27.63 - 23.32 = 4.31 and 27.63 + 4.31 = 31.94.) This gives it a movement of 8.62 from its low of 23.32, or 36.96%. |
| Now let us look at a chart of XLK. |

|
| Figure 2: SPDR Technology Index ETF. |
| Graphic provided by: AdvancedGET. |
| |
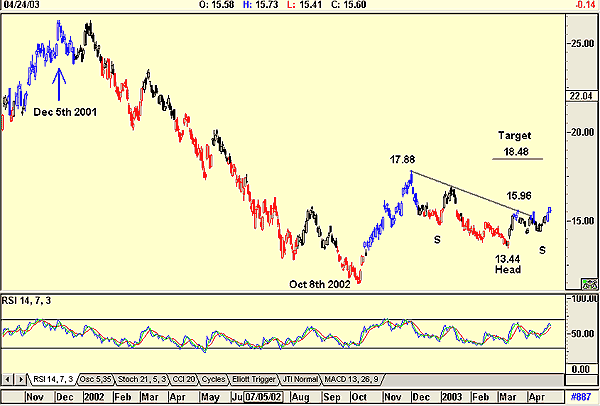
| Once again the chart topped out on December 5th, 2001, and bottomed on October 8th, in exactly the same pattern as the QQQs. It then moved up to 17.88 on the second of December whereas the QQQs topped on the 20th of November. This could be a data error on the QQQs or an overeager buyer that pushed it to an unusual high. The XLK has also formed an inverse head and shoulder pattern, with its head at 13.44 on March 12, 2003 as compared to February 14 of the QQQs but the Q's show a double bottom with the second bottom on the 12th of March, 2003. XLK's target is calculated at 18.48, (15.96 - 13.44 = 2.52. 15.96 + 2.52 = 18.48 ) This gives it a 37.50% target from the low of 13.44 (18.48 - 13.44 = 5.04. (5.04 / 13.44 )*100 = 37.50 ) compared to the 36.96% of the QQQs. |
| The two charts show an excellent correlation. However, where QQQs still have to break above the neckline, the XLK has already given a buy signal by breaking above the neckline. |
| Can you trade the XLK in place of the QQQs? Why not? Both trade with good volume, although the Q's have far higher volume than the XLK. Both follow the same chart pattern with indicators tracing the same pattern. The advantage though is that 1000 shares of QQQ at today's prices cost $27,480 while 1000 XLK shares cost $15,600, yet both give more or less the same percentage return. |
Has been a technical analyst since 1969, and has worked as a futures and options trader with First Financial Futures in Johannesburg, South Africa.
| Address: | 3256 West 24th Ave |
| Vancouver, BC | |
| Phone # for sales: | 6042634214 |
| E-mail address: | petroosp@gmail.com |
Click here for more information about our publications!
Comments
Date: 05/06/03Rank: 4Comment:

Request Information From Our Sponsors
- VectorVest, Inc.
- Executive Premier Workshop
- One-Day Options Course
- OptionsPro
- Retirement Income Workshop
- Sure-Fire Trading Systems (VectorVest, Inc.)
- Trading as a Business Workshop
- VectorVest 7 EOD
- VectorVest 7 RealTime/IntraDay
- VectorVest AutoTester
- VectorVest Educational Services
- VectorVest OnLine
- VectorVest Options Analyzer
- VectorVest ProGraphics v6.0
- VectorVest ProTrader 7
- VectorVest RealTime Derby Tool
- VectorVest Simulator
- VectorVest Variator
- VectorVest Watchdog
- StockCharts.com, Inc.
- Candle Patterns
- Candlestick Charting Explained
- Intermarket Technical Analysis
- John Murphy on Chart Analysis
- John Murphy's Chart Pattern Recognition
- John Murphy's Market Message
- MurphyExplainsMarketAnalysis-Intermarket Analysis
- MurphyExplainsMarketAnalysis-Visual Analysis
- StockCharts.com
- Technical Analysis of the Financial Markets
- The Visual Investor
