HOT TOPICS LIST
- MACD
- Fibonacci
- RSI
- Gann
- ADXR
- Stochastics
- Volume
- Triangles
- Futures
- Cycles
- Volatility
- ZIGZAG
- MESA
- Retracement
- Aroon
INDICATORS LIST
LIST OF TOPICS
PRINT THIS ARTICLE
by Koos van der Merwe
XM Satellite Radio Holdings Inc. (XMSR) is developing a new band of radio. The system will use direct satellite-to-receiver broadcasting technology to provide listeners with crystal-clear sound seamlessly from coast to coast.
Position: Accumulate
Koos van der Merwe
Has been a technical analyst since 1969, and has worked as a futures and options trader with First Financial Futures in Johannesburg, South Africa.
PRINT THIS ARTICLE
TREND-CHANNEL
XM Satellite Radio Inc.
04/23/03 12:06:23 PMby Koos van der Merwe
XM Satellite Radio Holdings Inc. (XMSR) is developing a new band of radio. The system will use direct satellite-to-receiver broadcasting technology to provide listeners with crystal-clear sound seamlessly from coast to coast.
Position: Accumulate
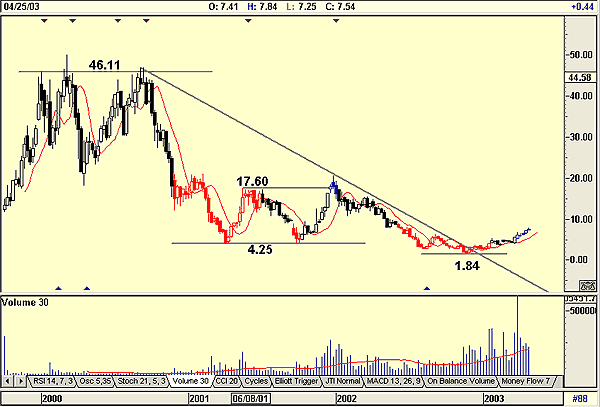
| Looking at a weekly chart (Figure 1), the first thing that strikes you is the triple top. It formed at $46.11 on low volume in the period between January 2000 to September 2000. A price rise on low volume is weakness, and as expected, the price fell away. That the price could not break above the triple top is a further sign of weakness, but this was the time of the technology bubble when innovative stocks were bid up to crazy prices and fell just as quickly when the bubble burst. |
| Next you will see the double bottom that formed at $4.25. Double bottoms are a sign of strength, and the price showed strength by rising very quickly to $17.60 on above average volume. With the price range now between $4.25 to $17.60, the price rose strongly and on strong volume tested and then broke above the $17.60 resistance. But it did not hold, and the price fell away on falling volume to form a new low at $1.84, slicing through the support at $4.25. A disappointing performance after much promise. |

|
| Figure 1: Weekly chart of XM Satellite Radio. |
| Graphic provided by: AdvancedGET. |
| |
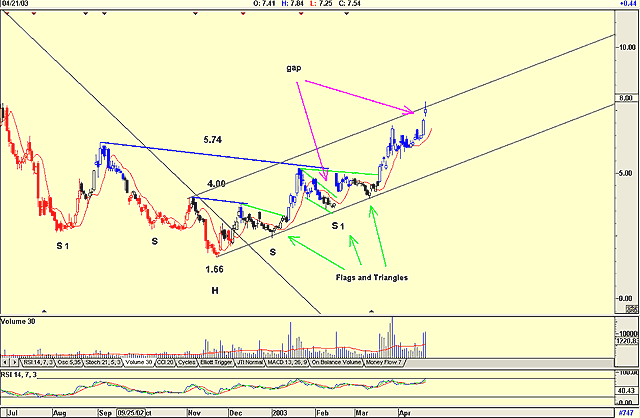
But did the share truly show weakness? An astute technician would have seen that all of XM's rises were on rising volume. Now a saucer is developing with volume rising to unusual proportions. Saucer shapes are usually bullish. Finally, the price has broken above the long-term downsloping trendline.  Figure 2: Daily chart of XM Satellite Radio. Looking at the daily chart, the large saucer resolves into possibly two head and shoulder patterns. A small one with a target of $6.34 ($4.00 - $1.66 = $2.34 + $4.00 = $6.34) and a larger one with a target of $9.82 ($5.74 - $1.66 = $4.08 + $5.74 = $9.82) |
| But be aware of the following. The price is rising on above average volume, yet falling on weak volume, and the price is following a support line upwards. The number of gaps and small triangles and flags that have formed are all suggesting bullishness. |
| The price has reached the upper resistance line, which means that you should expect a retracement. The RSI indicator is not oversold (above 70), which suggests that should a retracement occur, it could be another consolidation phase with an eventual break above the resistance line. Finally, the double top target of $17.60 will have to be tested some time in the distant future. This is a share you can accumulate on any pullback. |
Has been a technical analyst since 1969, and has worked as a futures and options trader with First Financial Futures in Johannesburg, South Africa.
| Address: | 3256 West 24th Ave |
| Vancouver, BC | |
| Phone # for sales: | 6042634214 |
| E-mail address: | petroosp@gmail.com |
Click here for more information about our publications!
Comments
Date: 04/24/03Rank: 5Comment:
Date: 05/11/03Rank: 4Comment:

|

Request Information From Our Sponsors
- StockCharts.com, Inc.
- Candle Patterns
- Candlestick Charting Explained
- Intermarket Technical Analysis
- John Murphy on Chart Analysis
- John Murphy's Chart Pattern Recognition
- John Murphy's Market Message
- MurphyExplainsMarketAnalysis-Intermarket Analysis
- MurphyExplainsMarketAnalysis-Visual Analysis
- StockCharts.com
- Technical Analysis of the Financial Markets
- The Visual Investor
- VectorVest, Inc.
- Executive Premier Workshop
- One-Day Options Course
- OptionsPro
- Retirement Income Workshop
- Sure-Fire Trading Systems (VectorVest, Inc.)
- Trading as a Business Workshop
- VectorVest 7 EOD
- VectorVest 7 RealTime/IntraDay
- VectorVest AutoTester
- VectorVest Educational Services
- VectorVest OnLine
- VectorVest Options Analyzer
- VectorVest ProGraphics v6.0
- VectorVest ProTrader 7
- VectorVest RealTime Derby Tool
- VectorVest Simulator
- VectorVest Variator
- VectorVest Watchdog
