HOT TOPICS LIST
- MACD
- Fibonacci
- RSI
- Gann
- ADXR
- Stochastics
- Volume
- Triangles
- Futures
- Cycles
- Volatility
- ZIGZAG
- MESA
- Retracement
- Aroon
INDICATORS LIST
LIST OF TOPICS
PRINT THIS ARTICLE
by David Penn
The VIX suggests that people are feeling better about stocks. Is that good news for the market?
Position: N/A
David Penn
Technical Writer for Technical Analysis of STOCKS & COMMODITIES magazine, Working-Money.com, and Traders.com Advantage.
PRINT THIS ARTICLE
VOLATILITY
VIX: The Agony of Ecstasy
04/23/03 09:12:05 AMby David Penn
The VIX suggests that people are feeling better about stocks. Is that good news for the market?
Position: N/A
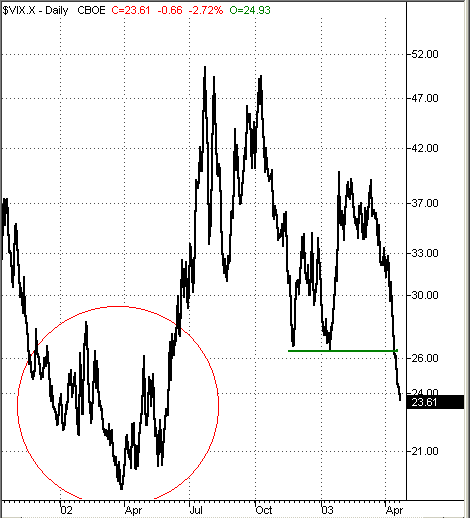
| In a Traders.com Advantage piece last March ("VIX Analyzed", March 31, 2003), contributor Gary Grosschadl suggested that the 31-32 level would prove significant in terms of determining whether or not the VIX would continue to head lower. As the hourly chart of the VIX (CBOE Volatility Index) shows, the VIX did indeed move south of the 31-32 level--and in fairly decisive fashion. In fact, the VIX is now headed swiftly toward levels it hasn't seen since the summer of 2002. |
| Is that a problem? It certainly might be. In mid-May of 2002, with the S&P 500 trading between 1050 and 1100, the VIX was making trough lows around 21. By early July, the VIX was soaring into the low 30s and, by mid-month, the VIX was into the low 40s. The S&P 500, at the same time, was plunging, reaching an intraday low just shy of 775--a drop of about 25% in two months. |

|
| A breakdown beneath 26.25 finds the VIX moving into an area that has typically suggested a significant market top was in the making. |
| Graphic provided by: TradeStation. |
| |
| As Gary Grosschadl pointed out in his article--and as other contributors have noted elsewhere--higher VIX levels tend to reflect greater pessimism while lower VIX levels tend to reflect greater optimism or, often, greater complacency that a rising market will continue to do so. Thus, extremely high levels in the VIX--as was the case, for example, in October 2002 with the VIX over 49--tend to mark fairly major bottoms. And exceptionally low levels in the VIX--as was the case in mid-May 2002--tend to mark significant tops (the VIX was at about 20 in March 2000 when the S&P 500 made its all-time top.) |
| Studying the VIX can be especially helpful now with the major market averages seeming to stall out after their 15%-odd rally from the March 2003 lows. As I've noted (see "Diagonal Triangles," Traders.com Advantage, April 15, 2003), previous rallies in the bear market that began in the spring of 2000 have averaged a gain of about 24%. This suggests--to a degree--that the current bear market rally may have more upside before it reverses. The fact that the VIX is plunging so sharply toward the "complacency zone" actually adds to the possibility that the S&P 500 could continue higher for a short while. |
| While the VIX cannot provide specific information about any given reversal possibility, it is worth noting that the last time the VIX approached these low levels, the S&P 500 was signficantly higher than it is today. In other words, there is the same level of optimism (or complacency) at an S&P 500 of 920 from January 2003 as there is for an S&P 500 of 870 in April. I suspect that the fact that lower levels on the S&P 500 are producing the same sort of optimism as higher levels have in the recent past can be accurately regarded as a negative sign for the equities markets. |
Technical Writer for Technical Analysis of STOCKS & COMMODITIES magazine, Working-Money.com, and Traders.com Advantage.
| Title: | Technical Writer |
| Company: | Technical Analysis, Inc. |
| Address: | 4757 California Avenue SW |
| Seattle, WA 98116 | |
| Phone # for sales: | 206 938 0570 |
| Fax: | 206 938 1307 |
| Website: | www.Traders.com |
| E-mail address: | DPenn@traders.com |
Traders' Resource Links | |
| Charting the Stock Market: The Wyckoff Method -- Books | |
| Working-Money.com -- Online Trading Services | |
| Traders.com Advantage -- Online Trading Services | |
| Technical Analysis of Stocks & Commodities -- Publications and Newsletters | |
| Working Money, at Working-Money.com -- Publications and Newsletters | |
| Traders.com Advantage -- Publications and Newsletters | |
| Professional Traders Starter Kit -- Software | |
Click here for more information about our publications!
Comments
Date: 04/24/03Rank: 5Comment:
Date: 05/15/03Rank: 4Comment:

|

Request Information From Our Sponsors
- StockCharts.com, Inc.
- Candle Patterns
- Candlestick Charting Explained
- Intermarket Technical Analysis
- John Murphy on Chart Analysis
- John Murphy's Chart Pattern Recognition
- John Murphy's Market Message
- MurphyExplainsMarketAnalysis-Intermarket Analysis
- MurphyExplainsMarketAnalysis-Visual Analysis
- StockCharts.com
- Technical Analysis of the Financial Markets
- The Visual Investor
- VectorVest, Inc.
- Executive Premier Workshop
- One-Day Options Course
- OptionsPro
- Retirement Income Workshop
- Sure-Fire Trading Systems (VectorVest, Inc.)
- Trading as a Business Workshop
- VectorVest 7 EOD
- VectorVest 7 RealTime/IntraDay
- VectorVest AutoTester
- VectorVest Educational Services
- VectorVest OnLine
- VectorVest Options Analyzer
- VectorVest ProGraphics v6.0
- VectorVest ProTrader 7
- VectorVest RealTime Derby Tool
- VectorVest Simulator
- VectorVest Variator
- VectorVest Watchdog
