HOT TOPICS LIST
- MACD
- Fibonacci
- RSI
- Gann
- ADXR
- Stochastics
- Volume
- Triangles
- Futures
- Cycles
- Volatility
- ZIGZAG
- MESA
- Retracement
- Aroon
INDICATORS LIST
LIST OF TOPICS
PRINT THIS ARTICLE
by Gary Grosschadl
A morning doji star reversal marks the bottom of this chart.
What are the upside targets?
Position: Hold
Gary Grosschadl
Independent Canadian equities trader and technical analyst based in Peterborough
Ontario, Canada.
PRINT THIS ARTICLE
CHART ANALYSIS
Celestica's Reversal Attempt
04/22/03 09:11:47 AMby Gary Grosschadl
A morning doji star reversal marks the bottom of this chart.
What are the upside targets?
Position: Hold
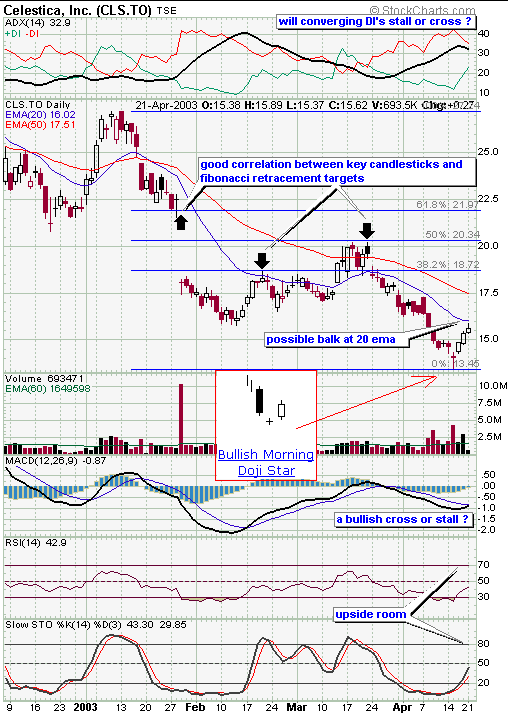
| After an extended downturn a morning doji star pattern can be a powerful reversal pattern. This is a slight deviation from the ideal pattern, as preferably the bearish candle that begins this three candle pattern should be a longer bodied candle. However it is close enough to warrant some respect. |
| Indicator analysis shows bullish intent, except for the directional movement (DMI via ADX/DIs) and MACD (moving average convergence/divergence) which are closing in on possible stall points. When MACD is on the verge of crossover and DIs are converging on the directional movement indicator (top of chart), you have to be somewhat cautious. These points can also become stall points if the MACD and DIs refuse to cross. It is prudent to wait for these indicators to actually cross. The MACD in this case should cross before the DIs. The other two indicators displayed show some bullish upside room before showing overbought danger. |

|
| Celestica's daily chart. |
| Graphic provided by: StockCharts.com. |
| |
| Should the stock make a bullish move beyond the 20-day EMA (another possible stall point), then the Fibonacci retracement levels on the chart allow for some reasonable upside targets. Note that these points relate well to previous meaningful candle points. Before these levels can be tested, the stock has to overcome possible resistance from its 50-day EMA, currently at the $17.50 mark. Watch for signs of reversal at these moving averages as the immediate upside tests. Success here will likely bring these higher retracement levels, as marked on the chart, into play. Again watch for possible reversal patterns at or near these marks to time the exit of long positions or target aggressive short positions. |
Independent Canadian equities trader and technical analyst based in Peterborough
Ontario, Canada.
| Website: | www.whatsonsale.ca/financial.html |
| E-mail address: | gwg7@sympatico.ca |
Click here for more information about our publications!
Comments
Date: 04/24/03Rank: 5Comment:

Request Information From Our Sponsors
- StockCharts.com, Inc.
- Candle Patterns
- Candlestick Charting Explained
- Intermarket Technical Analysis
- John Murphy on Chart Analysis
- John Murphy's Chart Pattern Recognition
- John Murphy's Market Message
- MurphyExplainsMarketAnalysis-Intermarket Analysis
- MurphyExplainsMarketAnalysis-Visual Analysis
- StockCharts.com
- Technical Analysis of the Financial Markets
- The Visual Investor
- VectorVest, Inc.
- Executive Premier Workshop
- One-Day Options Course
- OptionsPro
- Retirement Income Workshop
- Sure-Fire Trading Systems (VectorVest, Inc.)
- Trading as a Business Workshop
- VectorVest 7 EOD
- VectorVest 7 RealTime/IntraDay
- VectorVest AutoTester
- VectorVest Educational Services
- VectorVest OnLine
- VectorVest Options Analyzer
- VectorVest ProGraphics v6.0
- VectorVest ProTrader 7
- VectorVest RealTime Derby Tool
- VectorVest Simulator
- VectorVest Variator
- VectorVest Watchdog
