HOT TOPICS LIST
- MACD
- Fibonacci
- RSI
- Gann
- ADXR
- Stochastics
- Volume
- Triangles
- Futures
- Cycles
- Volatility
- ZIGZAG
- MESA
- Retracement
- Aroon
INDICATORS LIST
LIST OF TOPICS
PRINT THIS ARTICLE
by Gary Grosschadl
This pharmaceutical stock trades in both side of the border and is focused on the research, development, and commercialization of immune modulation therapy for the treatment of cardiovascular and other inflammatory diseases.
Position: Hold
Gary Grosschadl
Independent Canadian equities trader and technical analyst based in Peterborough
Ontario, Canada.
PRINT THIS ARTICLE
ASCENDING TRIANGLES
Vasogen Inc. Nears Pattern Completion
04/21/03 01:05:13 PMby Gary Grosschadl
This pharmaceutical stock trades in both side of the border and is focused on the research, development, and commercialization of immune modulation therapy for the treatment of cardiovascular and other inflammatory diseases.
Position: Hold
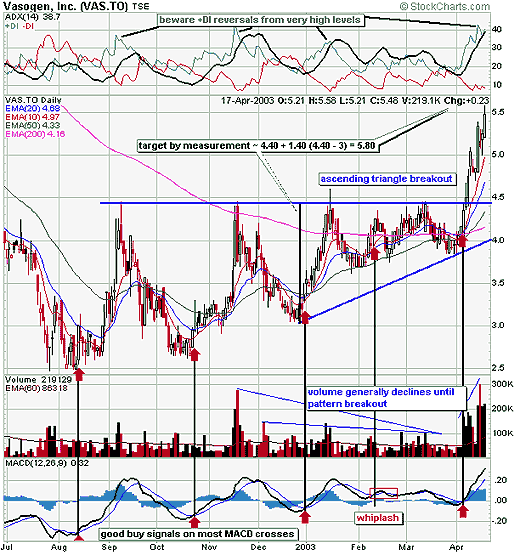
| This chart serves as a good example of an ascending triangle breakout. The top trendline was strongly established by multiple trendline touches. As the pattern developed there was a general decline in volume as the bulls tired of waiting for a breakout and weaker hands were flushed out. This pattern changed when an actual breakout occured on substantially increasing volume. |
| As the chart shows, this stock responded well to buy signals from the MACD (moving average convergence/divergence). I generally watch and use two settings: the default setting of 12/26/9 and the faster 5/15/9 to gauge the stock's movement. Generally the quicker setting is more responsive to short-term changes and so carries a greater whiplash danger. When a stock shows a history of good response to the shorter, quicker setting, then I will prefer that setting. The MACD works by using the difference between two moving averages and then plotting the line on an oscillator. Then a 9-day EMA of this MACD line is used as a trigger line. When the MACD moves above its 9-day EMA, a bullish crossover is deemed. A bearish crossover occurs with a MACD move below its 9-day EMA. I usually find the buy signals more timely than the sell signals as the chart shows. In this case the MACD 12/26/9 worked very well with the MACD line constructed using the difference between the 12- and 26-day EMAs and a trigger line using a 9-day EMA. |

|
| Daily chart of Vasogen. |
| Graphic provided by: StockCharts.com. |
| |
| The ascending triangle is nearing the estimated upside fulfillment target. The target is found by measuring the widest part of triangle and adding it to the area above the breakout. Note previous lows did not line up well enough to extend the triangle to the downside. This suggests you should watch for a possible reversal pattern at or near $5.80. |
| A further observation is made using the ADX/DI lines (directional movement) at the top of the chart. When +DI reverses from high levels, it often marks a peak in the stock price. At times this is a more timely signal than watching for a peaking out or reversal in the ADX line. |
| So in summary, a reversal in Vasogen may be coming soon and this would be a prudent exit sign for long positions and may set up aggressive short positions, but likely only to the 10- or 20-day EMAs shown on the chart. |
Independent Canadian equities trader and technical analyst based in Peterborough
Ontario, Canada.
| Website: | www.whatsonsale.ca/financial.html |
| E-mail address: | gwg7@sympatico.ca |
Click here for more information about our publications!
Comments
Date: 04/24/03Rank: 5Comment:

|

Request Information From Our Sponsors
- StockCharts.com, Inc.
- Candle Patterns
- Candlestick Charting Explained
- Intermarket Technical Analysis
- John Murphy on Chart Analysis
- John Murphy's Chart Pattern Recognition
- John Murphy's Market Message
- MurphyExplainsMarketAnalysis-Intermarket Analysis
- MurphyExplainsMarketAnalysis-Visual Analysis
- StockCharts.com
- Technical Analysis of the Financial Markets
- The Visual Investor
- VectorVest, Inc.
- Executive Premier Workshop
- One-Day Options Course
- OptionsPro
- Retirement Income Workshop
- Sure-Fire Trading Systems (VectorVest, Inc.)
- Trading as a Business Workshop
- VectorVest 7 EOD
- VectorVest 7 RealTime/IntraDay
- VectorVest AutoTester
- VectorVest Educational Services
- VectorVest OnLine
- VectorVest Options Analyzer
- VectorVest ProGraphics v6.0
- VectorVest ProTrader 7
- VectorVest RealTime Derby Tool
- VectorVest Simulator
- VectorVest Variator
- VectorVest Watchdog
