HOT TOPICS LIST
- MACD
- Fibonacci
- RSI
- Gann
- ADXR
- Stochastics
- Volume
- Triangles
- Futures
- Cycles
- Volatility
- ZIGZAG
- MESA
- Retracement
- Aroon
INDICATORS LIST
LIST OF TOPICS
PRINT THIS ARTICLE
by Gary Grosschadl
This energy play shows several signs of topping out, making it a prudent sell.
Position: Sell
Gary Grosschadl
Independent Canadian equities trader and technical analyst based in Peterborough
Ontario, Canada.
PRINT THIS ARTICLE
CHART ANALYSIS
Center Point Energy (CNP) Topping Out
04/18/03 08:04:28 AMby Gary Grosschadl
This energy play shows several signs of topping out, making it a prudent sell.
Position: Sell
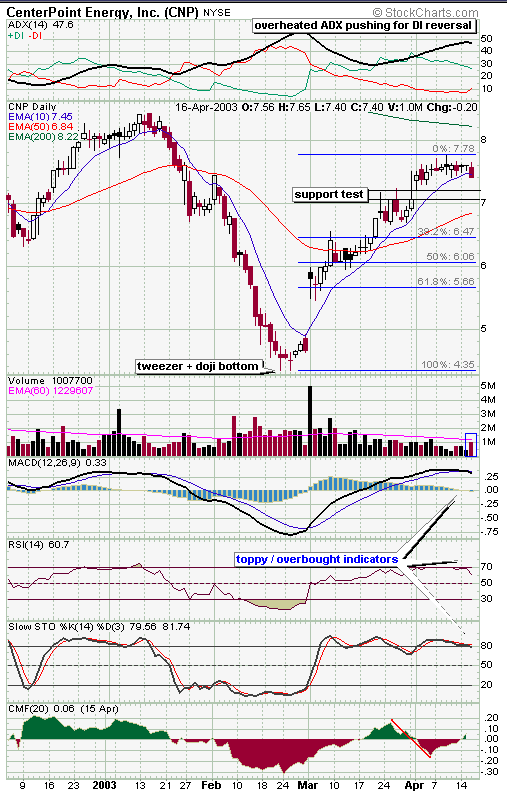
| In less than four months Center Point Energy has made a rapid decline and a similar ascent, indicating the volatility of this stock. Note the bottom formation - a combination of a tweezer and doji bottom. A tweezer bottom has a pincher type formation as shown by those bottom tails. The fact that a doji candlestick (small cross showing equal open and close) was part of the tweezer makes it more compelling. Doji candles often mark turning points at tops and bottoms as indecision or a balance between bulls and bears indicates changing momentum. |
| In the past two weeks a number of weak candlesticks have appeared, pointing to toppiness here. A spinning top marks the top here. Before that we see a series of other small bodied candles with upper shadows or tails. These point to diminished bullish power and throw further upside into serious question. The last bearish candle shows a close below 10-day EMA support, another sign of trouble at the top. |

|
| Daily chart of CNP. |
| Graphic provided by: StockCharts.com. |
| |
| Indicator analysis shows corroborating evidence of likely downside action. The DMI or directional movement indicator (a trending indicator) at the top of the chart shows a reversal in trend likely occuring as overheated ADX (generally above 40 and above both DIs) appears to have topped out and is reversing direction. This indicates the previous bullish trend may reverse. As the DIs converge, bullish power +DI is waning while bearish power -DI is growing. If this continues a crossover may occur giving the bears the upper hand. |
| The MACD (moving average convergence/divergence), RSI (relative strength index) and stochastics all paint a similar picture of topping out and starting to come down from overbought territory. The CMF or Chaikin money flow oscillator (developed by Marc Chaikin) is used to help decipher accumulation and distribution pressure (buying/selling). Here we see clear signs of selling pressure as the stock price was still trying to go higher; this can be viewed as negative divergence to price action. |
| In summary, this stock looks poised to test lower support. Should initial support at or near $7 fail then the 50-day EMA is the next likely test. Failure here then brings the Fibonacci retracement levels into the picture. Look for signs of support/failure at those levels. Look back at the last precipitous decline and note the stock's action as it fell through its 50-day EMA. After falling through, it came back for a test and failed, bringing a larger decline. Should this pattern repeat, a good shorting opportunity may present itself for the alert trader. |
Independent Canadian equities trader and technical analyst based in Peterborough
Ontario, Canada.
| Website: | www.whatsonsale.ca/financial.html |
| E-mail address: | gwg7@sympatico.ca |
Click here for more information about our publications!
PRINT THIS ARTICLE

Request Information From Our Sponsors
- StockCharts.com, Inc.
- Candle Patterns
- Candlestick Charting Explained
- Intermarket Technical Analysis
- John Murphy on Chart Analysis
- John Murphy's Chart Pattern Recognition
- John Murphy's Market Message
- MurphyExplainsMarketAnalysis-Intermarket Analysis
- MurphyExplainsMarketAnalysis-Visual Analysis
- StockCharts.com
- Technical Analysis of the Financial Markets
- The Visual Investor
- VectorVest, Inc.
- Executive Premier Workshop
- One-Day Options Course
- OptionsPro
- Retirement Income Workshop
- Sure-Fire Trading Systems (VectorVest, Inc.)
- Trading as a Business Workshop
- VectorVest 7 EOD
- VectorVest 7 RealTime/IntraDay
- VectorVest AutoTester
- VectorVest Educational Services
- VectorVest OnLine
- VectorVest Options Analyzer
- VectorVest ProGraphics v6.0
- VectorVest ProTrader 7
- VectorVest RealTime Derby Tool
- VectorVest Simulator
- VectorVest Variator
- VectorVest Watchdog
