HOT TOPICS LIST
- MACD
- Fibonacci
- RSI
- Gann
- ADXR
- Stochastics
- Volume
- Triangles
- Futures
- Cycles
- Volatility
- ZIGZAG
- MESA
- Retracement
- Aroon
INDICATORS LIST
LIST OF TOPICS
PRINT THIS ARTICLE
by Gary Grosschadl
This Canadian financial stock has made a break past triangle resistance, which follows the strength of the financials in general the past week.
Position: Hold
Gary Grosschadl
Independent Canadian equities trader and technical analyst based in Peterborough
Ontario, Canada.
PRINT THIS ARTICLE
SYMMETRICAL TRIANGLE
Power Financial Corp. Makes a Triangle Break
04/17/03 10:12:31 AMby Gary Grosschadl
This Canadian financial stock has made a break past triangle resistance, which follows the strength of the financials in general the past week.
Position: Hold
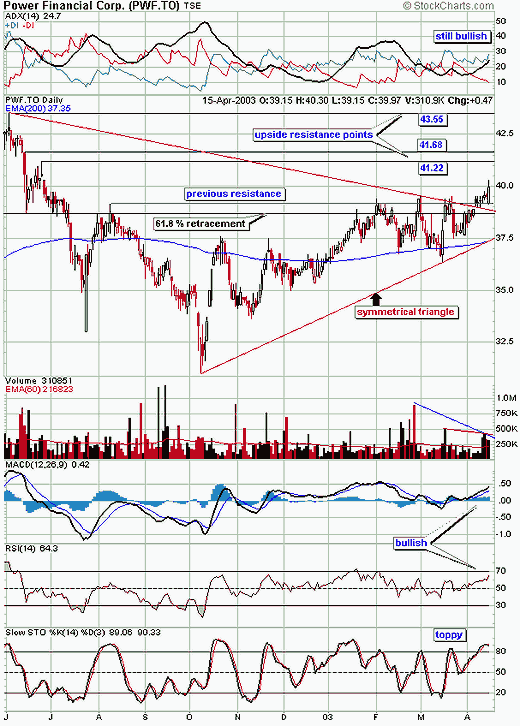
| At the same time this triangle break occured, two other key levels were also broken to the upside, giving this breakout some extra credence. Previous candlestick resistance points are indicated by the horizontal line on the chart and a Fibonacci retracement level. This 61.8% retracement level is measured between the high and low of the chart and is usually a significant point, especially since it is the last common level before 100% retracement. This could indicate additional upside room to this latest bullish surge. |
| Volume generally declined as the triangle progressed (except for a couple of surges off the 200-day EMA) and this is normal for this pattern. There should be volume confirmation as the triangle breaks and this was delayed by a few days so is a little suspect. |

|
| Daily chart |
| Graphic provided by: StockCharts.com. |
| |
| Indicator analysis also provides some clues. The DMI, or directional movement indicator, at the top of the chart is in a bullish mode. As long as +DI is on top (and not shrinking) and an upsloping ADX in the middle of both DIs, then the bulls are firmly in charge. The last candlestick showing is a bit of a mixed blessing. This bullish engulfing candlestick is normally a very bullish sign but when it occurs at what may be the top of an upswing, it can be referred as a "last bullish engulfing." This actually has a negative connotation but needs confirmation to the downside. This would indicate a possible reversal showing that the bulls may be spent and unable to press higher. |
| The indicators below the chart also offer mixed blessings. While the MACD (moving average convergence/divergence) and the RSI (relative strength index) are both in a bullish mode, the stochastics are in overbought territory. A stochastic downturn below the 80 level could mean a downleg similar to the last two occurences. |
| Should the bullish drive continue, the next likely resistance levels related to previous notable candlestick levels, are marked on the chart. Watch for reversals at or near those points. It should also be mentioned that by measurement (the widest part of triangle) the boldest upside target for this symmetrical triangle would be a gain of 10 points past the breakout level which would take us to $50. In summary, I would watch for a move either way past this engulfing candlestick. A move up negates my concern for the "last engulfing" implication and brings the overhead resistance levels into play. A move down has bearish implications and may mean a failed breakout move. This could entail a move back to the triangle's apex for another test. |
Independent Canadian equities trader and technical analyst based in Peterborough
Ontario, Canada.
| Website: | www.whatsonsale.ca/financial.html |
| E-mail address: | gwg7@sympatico.ca |
Click here for more information about our publications!
PRINT THIS ARTICLE

|

Request Information From Our Sponsors
- StockCharts.com, Inc.
- Candle Patterns
- Candlestick Charting Explained
- Intermarket Technical Analysis
- John Murphy on Chart Analysis
- John Murphy's Chart Pattern Recognition
- John Murphy's Market Message
- MurphyExplainsMarketAnalysis-Intermarket Analysis
- MurphyExplainsMarketAnalysis-Visual Analysis
- StockCharts.com
- Technical Analysis of the Financial Markets
- The Visual Investor
- VectorVest, Inc.
- Executive Premier Workshop
- One-Day Options Course
- OptionsPro
- Retirement Income Workshop
- Sure-Fire Trading Systems (VectorVest, Inc.)
- Trading as a Business Workshop
- VectorVest 7 EOD
- VectorVest 7 RealTime/IntraDay
- VectorVest AutoTester
- VectorVest Educational Services
- VectorVest OnLine
- VectorVest Options Analyzer
- VectorVest ProGraphics v6.0
- VectorVest ProTrader 7
- VectorVest RealTime Derby Tool
- VectorVest Simulator
- VectorVest Variator
- VectorVest Watchdog
