HOT TOPICS LIST
- MACD
- Fibonacci
- RSI
- Gann
- ADXR
- Stochastics
- Volume
- Triangles
- Futures
- Cycles
- Volatility
- ZIGZAG
- MESA
- Retracement
- Aroon
INDICATORS LIST
LIST OF TOPICS
PRINT THIS ARTICLE
by Arthur Hill
The NYSE AD line (advance-decline line) recently moved above its January high and reflects strong performance among the rank-and-file.
Position: N/A
Arthur Hill
Arthur Hill is currently editor of TDTrader.com, a website specializing in trading strategies, sector/industry specific breadth stats and overall technical analysis. He passed the Society of Technical Analysts (STA London) diploma exam with distinction is a Certified Financial Technician (CFTe). Prior to TD Trader, he was the Chief Technical Analyst for Stockcharts.com and the main contributor to the ChartSchool.
PRINT THIS ARTICLE
A/D LINE
Rank-and-File Lead the Advance
04/17/03 08:45:23 AMby Arthur Hill
The NYSE AD line (advance-decline line) recently moved above its January high and reflects strong performance among the rank-and-file.
Position: N/A
| The AD line is the cumulative total of advancing issues less declining issues. For example, if there were 1500 advancing issues and 1000 declining issues, AD net would be +500. This number would be added to the cumulative reading to form a time series plot that can be compared to the underlying index. If there were 1000 advancing issues and 1500 declining issues, AD net would be -500 and 500 would be subtracted from the cumulative reading. |
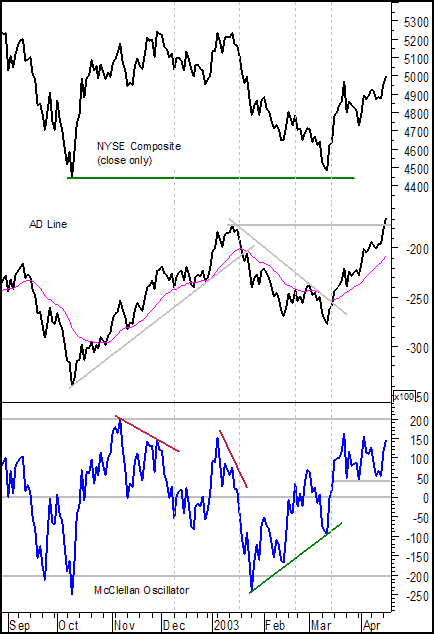
| Recent performance of the AD line shows broad strength in the recent advance. While the NYSE Composite tested its October low in March the AD line formed a higher low. In the strictest interpretation, the NYSE Composite held above its prior low and a positive divergence did not occur. However, the March low in the AD line is significantly higher than the corresponding low in the NYSE Composite. Theoretically speaking, a large positive divergence did form as the AD line showed much less weakness than the NYSE Composite in March. |

|
| Figure 1: Close-only chart of the NYSE Composite, plotted with the AD line and McClellan oscillator. |
| Graphic provided by: MetaStock. |
| |
| Less weakness is one thing and actual strength is another. After forming a higher low in March, the AD line moved above its January high on April 15. The NYSE has yet to challenge its January high, but strength in the AD line bodes well for this broad-based index. |
| Even though the AD line shows excellent strength, traders may turn to the McClellan oscillator for early signs of weakness. The McClellan oscillator equals the difference between two exponential moving averages of advancing issues less declining issues (19-day EMA less the 39-day EMA). The oscillator works like MACD as traders can looks for positive/negative divergences as well as crosses above/below zero. The McClellan oscillator has been range bound between 45 and 165 for April. A slight negative divergence may be forming, but the indicator is firmly bullish as long as the April low at +45 holds. |
Arthur Hill is currently editor of TDTrader.com, a website specializing in trading strategies, sector/industry specific breadth stats and overall technical analysis. He passed the Society of Technical Analysts (STA London) diploma exam with distinction is a Certified Financial Technician (CFTe). Prior to TD Trader, he was the Chief Technical Analyst for Stockcharts.com and the main contributor to the ChartSchool.
| Title: | Editor |
| Company: | TDTrader.com |
| Address: | Willem Geetsstraat 17 |
| Mechelen, B2800 | |
| Phone # for sales: | 3215345465 |
| Website: | www.tdtrader.com |
| E-mail address: | arthurh@tdtrader.com |
Traders' Resource Links | |
| TDTrader.com has not added any product or service information to TRADERS' RESOURCE. | |
Click here for more information about our publications!
Comments
Date: 04/27/03Rank: 4Comment:

Request Information From Our Sponsors
- VectorVest, Inc.
- Executive Premier Workshop
- One-Day Options Course
- OptionsPro
- Retirement Income Workshop
- Sure-Fire Trading Systems (VectorVest, Inc.)
- Trading as a Business Workshop
- VectorVest 7 EOD
- VectorVest 7 RealTime/IntraDay
- VectorVest AutoTester
- VectorVest Educational Services
- VectorVest OnLine
- VectorVest Options Analyzer
- VectorVest ProGraphics v6.0
- VectorVest ProTrader 7
- VectorVest RealTime Derby Tool
- VectorVest Simulator
- VectorVest Variator
- VectorVest Watchdog
- StockCharts.com, Inc.
- Candle Patterns
- Candlestick Charting Explained
- Intermarket Technical Analysis
- John Murphy on Chart Analysis
- John Murphy's Chart Pattern Recognition
- John Murphy's Market Message
- MurphyExplainsMarketAnalysis-Intermarket Analysis
- MurphyExplainsMarketAnalysis-Visual Analysis
- StockCharts.com
- Technical Analysis of the Financial Markets
- The Visual Investor
