HOT TOPICS LIST
- MACD
- Fibonacci
- RSI
- Gann
- ADXR
- Stochastics
- Volume
- Triangles
- Futures
- Cycles
- Volatility
- ZIGZAG
- MESA
- Retracement
- Aroon
INDICATORS LIST
LIST OF TOPICS
PRINT THIS ARTICLE
by Koos van der Merwe
Coolbrands (formerly Yogen Fruz) is a Canadian company that is waiting for a United States' Federal Trade Commission ruling that could, if favorable, double the size of the company. Nestle SA wants to take over Dreyer's Grand Ice Cream Inc., and in order to satisfy the FTC's challenge of the takeover, Nestle would have to divest itself of three of Dreyer's premium brands. Does a chart of Coolbrands give us any idea of what the outcome will be?
Position: Accumulate
Koos van der Merwe
Has been a technical analyst since 1969, and has worked as a futures and options trader with First Financial Futures in Johannesburg, South Africa.
PRINT THIS ARTICLE
CUP WITH HANDLE
Is Coolbrands Cooling Down?
04/18/03 10:56:26 AMby Koos van der Merwe
Coolbrands (formerly Yogen Fruz) is a Canadian company that is waiting for a United States' Federal Trade Commission ruling that could, if favorable, double the size of the company. Nestle SA wants to take over Dreyer's Grand Ice Cream Inc., and in order to satisfy the FTC's challenge of the takeover, Nestle would have to divest itself of three of Dreyer's premium brands. Does a chart of Coolbrands give us any idea of what the outcome will be?
Position: Accumulate
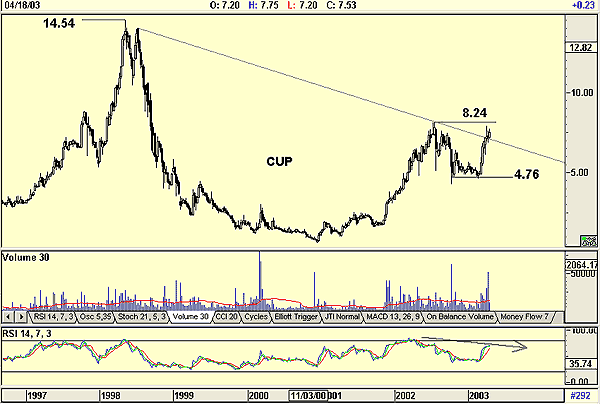
 Figure 1: Coolbrands weekly chart on the Canadian TSX market. Graphic provided by: Advanced GET A look at the first chart, a weekly chart, shows a huge cup and handle pattern with a definite buy signal should the price rise above $8.24. The long-term trendline from the high in 1998 has been broken, suggesting that the likelihood of the break is very good. However, although volume rose appreciably as the price shot up, recent volume has been below average. This suggests weakness, as does the downtrending RSI indicator. |
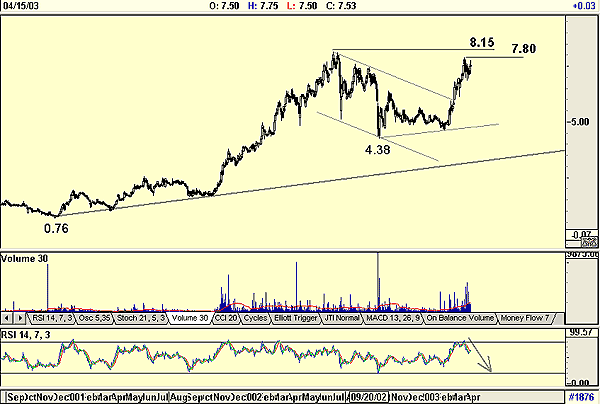
 Figure 2: Coolbrands daily chart. In the daily chart, I have shown the handle resistance at $8.15. However, you can also see the smaller cup and handle formation with handle resistance at $7.80. A break above this level suggests a target of $11.92 ($8.15 - $4.38 = $3.77, $8.15 + $3.77 = $11.92). What are the chances of this happening? The RSI indicator suggests this is unlikely, simply because it is pointing down. However, this negativity is not a certainty, as the share price did break upwards out of a downtrending flag formation. This in turn suggests a target of $15.54 ($8.15 - 0.76 = $7.39, $8.15 + $7.39 = $15.54). But the price movement the last three days has been upwards on falling volume, a sign of weakness. |

|
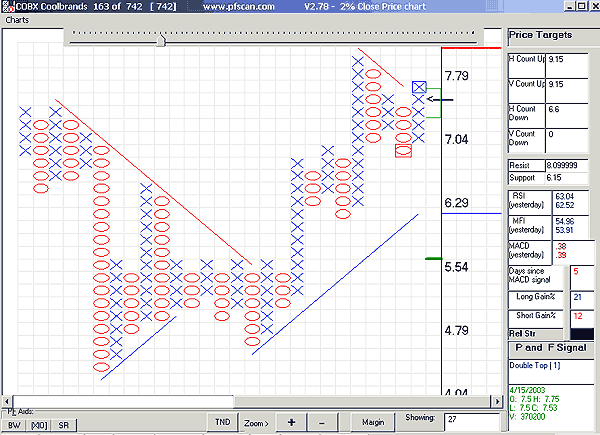
| Figure 3: Coolbrands P&F chart. |
| Graphic provided by: PFScan. |
| |
| Finally, a point and figure chart has given a buy signal but suggests a target of $9.15 on both a horizontal and vertical count. |
| Not one of the charts above is telling us what the FTC decision will be. Buying the stock at the present level and taking the chance that the decision will be favorable is a risk that could be taken. The risk/reward scenario is as follows. |
| The nearest, and my preferred estimate, is the P&F target at $9.15. This means that the reward is $1.84 ($9.15 - $7.31 = $1.84). Risk is a 10% stop-loss on the purchase price: $0.73. Working on a 2.5:1 risk reward ratio, $0.73 x 2.5 = $1.82. This figure is slightly less than my reward, therefore it is worth taking the risk and buying Coolbrands. I would suggest buying on any pullback rather than chasing the price upwards. |
Has been a technical analyst since 1969, and has worked as a futures and options trader with First Financial Futures in Johannesburg, South Africa.
| Address: | 3256 West 24th Ave |
| Vancouver, BC | |
| Phone # for sales: | 6042634214 |
| E-mail address: | petroosp@gmail.com |
Click here for more information about our publications!
PRINT THIS ARTICLE

Request Information From Our Sponsors
- StockCharts.com, Inc.
- Candle Patterns
- Candlestick Charting Explained
- Intermarket Technical Analysis
- John Murphy on Chart Analysis
- John Murphy's Chart Pattern Recognition
- John Murphy's Market Message
- MurphyExplainsMarketAnalysis-Intermarket Analysis
- MurphyExplainsMarketAnalysis-Visual Analysis
- StockCharts.com
- Technical Analysis of the Financial Markets
- The Visual Investor
- VectorVest, Inc.
- Executive Premier Workshop
- One-Day Options Course
- OptionsPro
- Retirement Income Workshop
- Sure-Fire Trading Systems (VectorVest, Inc.)
- Trading as a Business Workshop
- VectorVest 7 EOD
- VectorVest 7 RealTime/IntraDay
- VectorVest AutoTester
- VectorVest Educational Services
- VectorVest OnLine
- VectorVest Options Analyzer
- VectorVest ProGraphics v6.0
- VectorVest ProTrader 7
- VectorVest RealTime Derby Tool
- VectorVest Simulator
- VectorVest Variator
- VectorVest Watchdog
