HOT TOPICS LIST
- MACD
- Fibonacci
- RSI
- Gann
- ADXR
- Stochastics
- Volume
- Triangles
- Futures
- Cycles
- Volatility
- ZIGZAG
- MESA
- Retracement
- Aroon
INDICATORS LIST
LIST OF TOPICS
PRINT THIS ARTICLE
by Gary Grosschadl
This healthcare play has made a sizeable move from its bottom. How far can it run?
Position: Buy
Gary Grosschadl
Independent Canadian equities trader and technical analyst based in Peterborough
Ontario, Canada.
PRINT THIS ARTICLE
FIBONACCI
Finding a Target for D&K Healthcare
04/15/03 08:33:37 AMby Gary Grosschadl
This healthcare play has made a sizeable move from its bottom. How far can it run?
Position: Buy
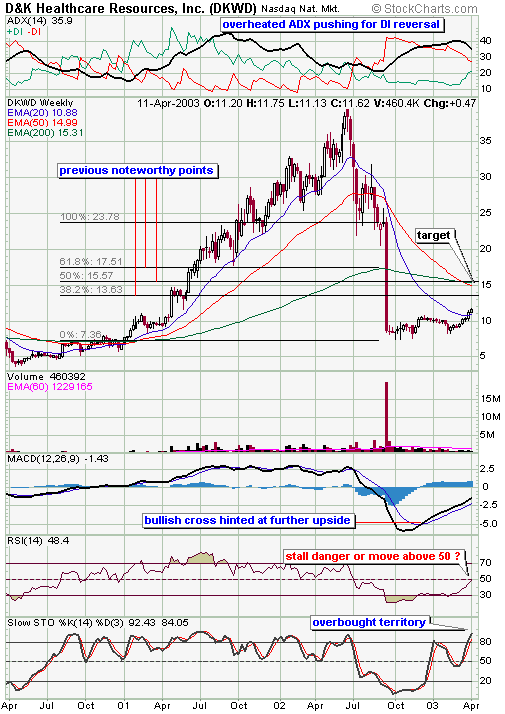
| The weekly chart of D&K Healthcare (DKWD) shows that the 20-period EMA has been a prominent feature in this stock's movements for over two years. During its dramatic climb from $5 to $40, this EMA has been strong support. When it finally made a sustained move below this moving average support in a swift downturn, what was support quickly turned into resistance. During the dive down from $30, DKWD only touched the 20-period EMA line once and never closed above it on the weekly chart. |
| Now seven months after falling below the $10 threshold, the stock has finally managed to rise above its 20-week EMA. This could very well mark another important turning point for DKWD. It's time to take a hard look at further upside possibilities using several tools. |

|
| DKWD weekly chart. |
| Graphic provided by: StockCharts.com. |
| |
| The most prominent candlestick on this chart is hard to miss. I will use retracement targets from the stock's low to the top of this huge candle to help provide upside targets that make sense. Using principles of Fibonacci ratios (Fibonacci was a 13th century mathematician who derived a special sequence of numbers and ratios that many technical traders use), I have marked the most commonly used ratios on the chart. The 38.2%, 50% and 61.8% levels are all reasonable targets, especially the 50% mark. I favour the 50% mark for several reasons. This area represents close proximity to the 50- and 200-period EMAs, near mid-candle resistance of both the largest candle in question and a large white candle from May 2001. The 38.2% level at $13.63 lines up with a previous congestion zone which could become resistance going forward. Whether this becomes a mere resting point or something more substantial remains to be seen. Should the stock make a bullish surge past the 50% retracement level of $15.57, then the 61.8% could become serious resistance at about $17.50. Note this relates to the top of a large white candle and this level was tested successfully several months later. |
| Further clues may come from the displayed indicators. The DMI or directional movement indicator on top of the chart shows the three components of ADX, +DI and -DI. Currently a high ADX level is prompting the DIs to converge, signaling an important reversal taking shape. If bullishness continues, the DIs will cross representing a shift of control to bullish power (+DI) from bearish power (-DI). The ideal bullish setup occurs when ADX is in between both DIs and ADX is still rising with +DI on top. The MACD (moving average convergence/divergence) shows a bullish setup as does the RSI (relative strength index). A cautionary note is that the 50 RSI level is an important level and a stall danger has to be considered. Likewise stochastics is in overbought territory. In a strong trending market, stochastics can stay in overbought levels for extended periods but high levels do bear watching for sudden downturns all the same. |
| In summary, several upside targets are outlined and traders should watch for reversals at or near these points. Support from a rising 20-period EMA may also be a good guide going forward. Small retracements to this line are acceptable for the patient trader but a serious breach below could mean a hasty exit for those wanting to protect profits. Should the stock rise well above the 20-period EMA then a trailing stop-loss would be advisable, perhaps using a shorter moving average such as the 10-period EMA. The daily charts should also be taken into account in a similar fashion. |
Independent Canadian equities trader and technical analyst based in Peterborough
Ontario, Canada.
| Website: | www.whatsonsale.ca/financial.html |
| E-mail address: | gwg7@sympatico.ca |
Click here for more information about our publications!
Comments

Request Information From Our Sponsors
- StockCharts.com, Inc.
- Candle Patterns
- Candlestick Charting Explained
- Intermarket Technical Analysis
- John Murphy on Chart Analysis
- John Murphy's Chart Pattern Recognition
- John Murphy's Market Message
- MurphyExplainsMarketAnalysis-Intermarket Analysis
- MurphyExplainsMarketAnalysis-Visual Analysis
- StockCharts.com
- Technical Analysis of the Financial Markets
- The Visual Investor
- VectorVest, Inc.
- Executive Premier Workshop
- One-Day Options Course
- OptionsPro
- Retirement Income Workshop
- Sure-Fire Trading Systems (VectorVest, Inc.)
- Trading as a Business Workshop
- VectorVest 7 EOD
- VectorVest 7 RealTime/IntraDay
- VectorVest AutoTester
- VectorVest Educational Services
- VectorVest OnLine
- VectorVest Options Analyzer
- VectorVest ProGraphics v6.0
- VectorVest ProTrader 7
- VectorVest RealTime Derby Tool
- VectorVest Simulator
- VectorVest Variator
- VectorVest Watchdog
