HOT TOPICS LIST
- MACD
- Fibonacci
- RSI
- Gann
- ADXR
- Stochastics
- Volume
- Triangles
- Futures
- Cycles
- Volatility
- ZIGZAG
- MESA
- Retracement
- Aroon
INDICATORS LIST
LIST OF TOPICS
PRINT THIS ARTICLE
by David Penn
Is an Elliott wave-style diagonal triangle in the S&P 500 anticipating a swift move to the downside?
Position: N/A
David Penn
Technical Writer for Technical Analysis of STOCKS & COMMODITIES magazine, Working-Money.com, and Traders.com Advantage.
PRINT THIS ARTICLE
TRIANGLES
Diagonal Triangles
04/15/03 10:36:33 AMby David Penn
Is an Elliott wave-style diagonal triangle in the S&P 500 anticipating a swift move to the downside?
Position: N/A
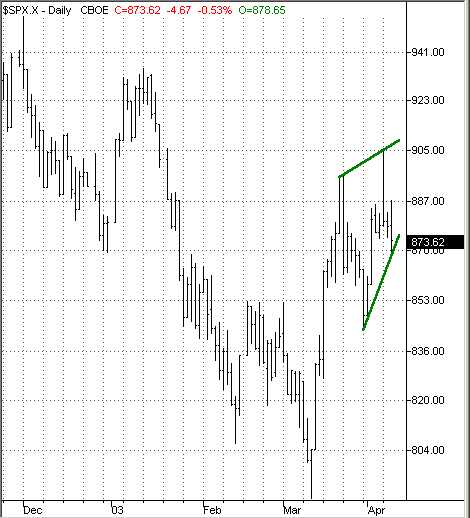
| The interesting thing about this potential EW-style diagonal triangle is that from a non-EW perspective, the formation has many of the same bearish aspects as a regular rising wedge. The formation in question begins in the correction from the March rally, a correction that starts with the peak of 896 on March 21st and ends with the trough on April 1st at 848. The S&P 500 did rally from this trough to make a higher high on April 7th at 905. As many have noted, the price action of April 7th was suggestive of some level of exhaustion on the side of the buyers, as both the open and the close were very near to the lows of the day. This exhaustion was confirmed, at least in the short-term, by the collapse in prices in the days afterwards. The S&P 500 fell again, this time to a low of about 869--importantly, this trough was significantly higher than the previous trough on April 1st. |
| The two converging trendlines that bound this price action, so far, has traced out a rising wedge type of formation--at least for traditional chart pattern readers. The price action from such wedges is often dramatic and typically--given the rising wedge--to the downside. However, it is worth noting that sometimes the compression effect that takes place in rising wedges can lead to a price explosion--as occurred with the rising wedge I spotted in natural gas prices right before their dramatic move to the upside in late February. |

|
| Figure 1: Will the compression of this potential rising wedge lead to a breakout on the upside, or a downside reversal? |
| Graphic provided by: TradeStation. |
| |
| In order for this rising wedge to become valid, prices for the S&P 500 would first have to find support around its current levels (a low of between 865 and 855 at the worst) and then rally up to take out the previous April 7th high above 900. This, again as the natural gas example proved, would represent a moment of truth for the current action in the S&P 500. If there is bullish follow-through on any move above the April 7th highs, then that would suggest that a powerful, post-compression move to the upside might indeed be in store. Pursuant to this possibility, recall that the rallies from the September 2001, July 2002 and October 2002 lows in the S&P 500 all peaked out after each gained approximately 24%. The distance from the March 2003 lows to the most recent peak on April 7th represents a gain of only 15%. Were the current rally to match previous, similar bear market rallies in the S&P 500, then an S&P 500 of about 978 would be expected. However, if the current price action in the S&P 500 acts like a more common rising wedge, then a downside break to where the rising wedge began--approximately 848--could be expected as part of an initial leg down, especially if the downside break is a precursor to a reversal in trend. |
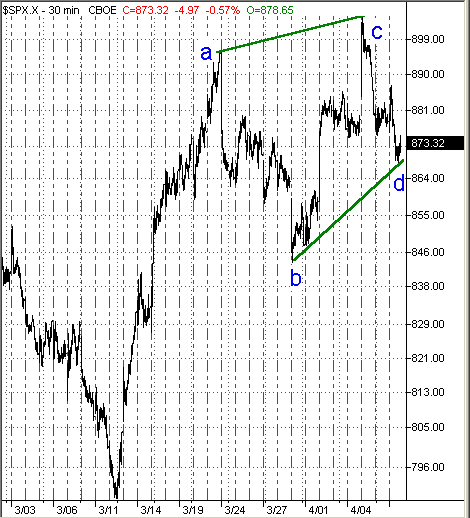
 Figure 2: Could this be an Elliott wave-esque corrective diagonal triangle? Note the clear, three wave patterns between trendline touches. In orthodox EW counting, diagonal triangles are usually labeled 1-2-3-4-5. I mentioned the Elliott wave concept of the diagonal triangle at the outset, mostly as part of an endeavor to understand just how to interpret the price action in the S&P 500 since the July 2002 decline. While I have not been able to find a model diagonal triangle in the EW literature that resembles the wave count I would otherwise tend to apply to the current formation (i.e., the March 21st peak being an "a," the April 1st trough being "b," the April 7th peak "c," and the April 9th trough a "d," with an "e" peak still to come), it seems like the possibility of an EW triangle--diagonal or otherwise--is such that those interested in studying EW patterns may find further grist for the mill here. |
Technical Writer for Technical Analysis of STOCKS & COMMODITIES magazine, Working-Money.com, and Traders.com Advantage.
| Title: | Technical Writer |
| Company: | Technical Analysis, Inc. |
| Address: | 4757 California Avenue SW |
| Seattle, WA 98116 | |
| Phone # for sales: | 206 938 0570 |
| Fax: | 206 938 1307 |
| Website: | www.Traders.com |
| E-mail address: | DPenn@traders.com |
Traders' Resource Links | |
| Charting the Stock Market: The Wyckoff Method -- Books | |
| Working-Money.com -- Online Trading Services | |
| Traders.com Advantage -- Online Trading Services | |
| Technical Analysis of Stocks & Commodities -- Publications and Newsletters | |
| Working Money, at Working-Money.com -- Publications and Newsletters | |
| Traders.com Advantage -- Publications and Newsletters | |
| Professional Traders Starter Kit -- Software | |
Click here for more information about our publications!
Comments

|

Request Information From Our Sponsors
- StockCharts.com, Inc.
- Candle Patterns
- Candlestick Charting Explained
- Intermarket Technical Analysis
- John Murphy on Chart Analysis
- John Murphy's Chart Pattern Recognition
- John Murphy's Market Message
- MurphyExplainsMarketAnalysis-Intermarket Analysis
- MurphyExplainsMarketAnalysis-Visual Analysis
- StockCharts.com
- Technical Analysis of the Financial Markets
- The Visual Investor
- VectorVest, Inc.
- Executive Premier Workshop
- One-Day Options Course
- OptionsPro
- Retirement Income Workshop
- Sure-Fire Trading Systems (VectorVest, Inc.)
- Trading as a Business Workshop
- VectorVest 7 EOD
- VectorVest 7 RealTime/IntraDay
- VectorVest AutoTester
- VectorVest Educational Services
- VectorVest OnLine
- VectorVest Options Analyzer
- VectorVest ProGraphics v6.0
- VectorVest ProTrader 7
- VectorVest RealTime Derby Tool
- VectorVest Simulator
- VectorVest Variator
- VectorVest Watchdog
