

HOT TOPICS LIST
- MACD
- Fibonacci
- RSI
- Gann
- ADXR
- Stochastics
- Volume
- Triangles
- Futures
- Cycles
- Volatility
- ZIGZAG
- MESA
- Retracement
- Aroon
INDICATORS LIST
LIST OF TOPICS
PRINT THIS ARTICLE
by Koos van der Merwe
The Nasdaq 100 Shares (QQQ), is an index tracking stock that trades on the AMEX (AMEX:QQQ). It is the first financial product created by the Nasdaq-Amex Market Group.
Position: Sell
Koos van der Merwe
Has been a technical analyst since 1969, and has worked as a futures and options trader with First Financial Futures in Johannesburg, South Africa.
PRINT THIS ARTICLE
CYCLES
QQQs Updated
04/16/03 09:56:09 AMby Koos van der Merwe
The Nasdaq 100 Shares (QQQ), is an index tracking stock that trades on the AMEX (AMEX:QQQ). It is the first financial product created by the Nasdaq-Amex Market Group.
Position: Sell
| QQQs can be traded as a stock - buying the stock or selling it short- but with the short sale, the uptick rule does not apply, so you have the advantage of not having to wait for a rise before selling short. |
| You can also trade the QQQs by buying or selling options. This has the advantage of gearing, or taking a position in the trend of the Nasdaq with a small amount of capital. Obviously the risk in option trading is greater than that of trading the QQQs because of the time value deterioration of the option, but when a trend is identified and there is low volatility or one's research is sound, option prices can be so cheap, especially when contrarian, that they are tempting. |
|
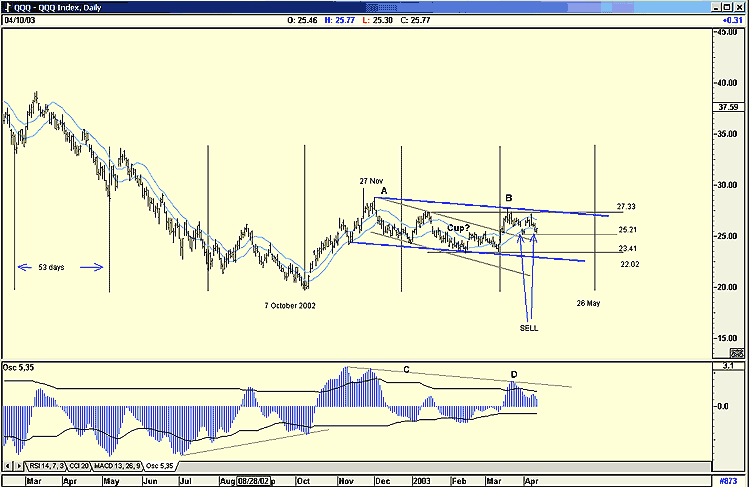
| QQQs: Putting it all together. |
| Graphic provided by: AdvancedGET. |
| |
| A look at the chart of the QQQs suggests that such a "tempting" situation could be unfolding at the moment for the immediate short-term. A look at the chart above highlights the following points. |
| 1. I have drawn in the 53-day cycle that my cycle finder has determined (see my article "More on Cycles and the S&P500," Traders.com Advantage, April 3, 2003), and have highlighted May 26th as the next cycle low. 2. The chart shows that the QQQs made a low on the October 7th, 2002 and moved up until November 27 before moving down in what appears to be a bull flag formation. I have shown two possible flags- one has been fulfilled, and the other is still to be fulfilled. I am writing about the latter. Should this be true, then the QQQs should fall to test the lower flag support line (blue line) before moving up to break the upper flag resistance line (blue line). It could test this level possibly on May 26, 2003. 3. Should the QQQs fall to the low of 22.02 as indicated above, then they would have to test and penetrate the resistance levels of 25.21, and 23.41. 4. Another bearish sign is that the QQQs have tested the trendline A B (upper blue flag line) three times without penetrating it. 5. The 5-35 oscillator also looks bearish, suggesting that its trend as shown by the trendline C-D is down. 6. Also note that the QQQ have given a JM sell signal. A JM band is a 15-day moving average offset by 2%. 7. A bullish sign is the possible cup and handle formation. A break above 27.33 will see a buy signal for this formation. 8. Another bullish sign is that the cup and handle formation could be an inverted head and shoulder formation, with a break above the neckline 27.33 suggesting a target of 31.25 (27.33 - 23.41 = 3.92; 27.33 + 3.92 = 31.25). |
| Conclusion I believe the QQQs have to first turn down and test any one of the support levels shown before turning up. This need not necessarily be at theMay 26 low. The trend of the oscillator has to be satisfied, meaning it must approach zero, and this could occur at any of the support levels shown. |
Has been a technical analyst since 1969, and has worked as a futures and options trader with First Financial Futures in Johannesburg, South Africa.
| Address: | 3256 West 24th Ave |
| Vancouver, BC | |
| Phone # for sales: | 6042634214 |
| E-mail address: | petroosp@gmail.com |
Click here for more information about our publications!
PRINT THIS ARTICLE

Request Information From Our Sponsors
- StockCharts.com, Inc.
- Candle Patterns
- Candlestick Charting Explained
- Intermarket Technical Analysis
- John Murphy on Chart Analysis
- John Murphy's Chart Pattern Recognition
- John Murphy's Market Message
- MurphyExplainsMarketAnalysis-Intermarket Analysis
- MurphyExplainsMarketAnalysis-Visual Analysis
- StockCharts.com
- Technical Analysis of the Financial Markets
- The Visual Investor
- VectorVest, Inc.
- Executive Premier Workshop
- One-Day Options Course
- OptionsPro
- Retirement Income Workshop
- Sure-Fire Trading Systems (VectorVest, Inc.)
- Trading as a Business Workshop
- VectorVest 7 EOD
- VectorVest 7 RealTime/IntraDay
- VectorVest AutoTester
- VectorVest Educational Services
- VectorVest OnLine
- VectorVest Options Analyzer
- VectorVest ProGraphics v6.0
- VectorVest ProTrader 7
- VectorVest RealTime Derby Tool
- VectorVest Simulator
- VectorVest Variator
- VectorVest Watchdog