HOT TOPICS LIST
- MACD
- Fibonacci
- RSI
- Gann
- ADXR
- Stochastics
- Volume
- Triangles
- Futures
- Cycles
- Volatility
- ZIGZAG
- MESA
- Retracement
- Aroon
INDICATORS LIST
LIST OF TOPICS
PRINT THIS ARTICLE
by Matt Blackman
Call it a buying climax or top reversal day, but whatever term you use to identify this move, it has 'sell' written all over it.
Position: N/A
Matt Blackman
Matt Blackman is a full-time technical and financial writer and trader. He produces corporate and financial newsletters, and assists clients in getting published in the mainstream media. He is the host of TradeSystemGuru.com. Matt has earned the Chartered Market Technician (CMT) designation. Find out what stocks and futures Matt is watching on Twitter at www.twitter.com/RatioTrade
PRINT THIS ARTICLE
REVERSAL
A Reversal Day for United Foods?
04/11/03 08:41:17 AMby Matt Blackman
Call it a buying climax or top reversal day, but whatever term you use to identify this move, it has 'sell' written all over it.
Position: N/A
| A reversal day takes place when a major battle between buyers and sellers occurs. Call it a perfect storm in equities. A number of conditions must come together to bring about a top reversal or buying climax. |
|

|
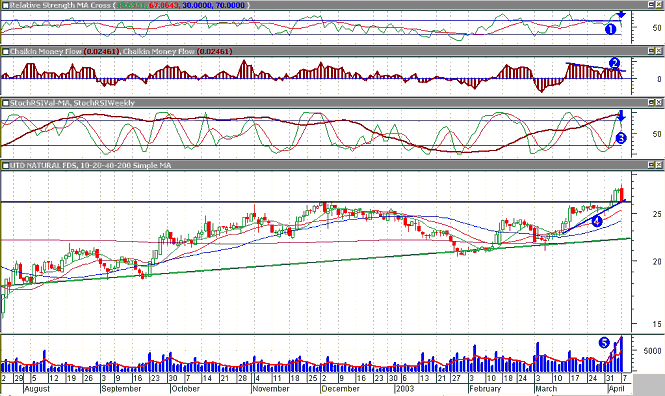
| Figure 1: Daily chart of United Natural Foods Inc. (UNFI) showing a reversal day and selling signal on the RSI and StochRSI (1 & 3), bearish negative divergence between the Chaikin Money Flow (2) and price (4), and the surge in volume (5) to a 100-day high. The resistance level (black line) that the stock recently broke had been tested and held three times since last April. |
| Graphic provided by: MetaStock. |
| |
| A similar move in the opposite direction has the reverse implication. It is called a bottom reversal or selling climax. The equity is in a downtrend, hits a new low on record volume and then closes above the high of the previous day. The outside day in this case would be an engulfing bull candlestick pattern. United Natural Foods Inc. (UNFI) hit a low of $7.00 in December 1999 and hit a high of $28.58 on April 7, 2003. The fact that it took a year to break $26.00 provides a clue that it offers very serious resistance. |
| How far it pulls back and whether this represents a trend reversal remains to be seen but this has all the makings of a reversal day (Figure 1). An initial decline in volume followed by a volume increase on falling price would be even more bearish adding greater credence to the reversal. Reversals in weekly and monthly time frames generally carry greater significance and often represent major trend reversals. |
Matt Blackman is a full-time technical and financial writer and trader. He produces corporate and financial newsletters, and assists clients in getting published in the mainstream media. He is the host of TradeSystemGuru.com. Matt has earned the Chartered Market Technician (CMT) designation. Find out what stocks and futures Matt is watching on Twitter at www.twitter.com/RatioTrade
| Company: | TradeSystemGuru.com |
| Address: | Box 2589 |
| Garibaldi Highlands, BC Canada | |
| Phone # for sales: | 604-898-9069 |
| Fax: | 604-898-9069 |
| Website: | www.tradesystemguru.com |
| E-mail address: | indextradermb@gmail.com |
Traders' Resource Links | |
| TradeSystemGuru.com has not added any product or service information to TRADERS' RESOURCE. | |
Click here for more information about our publications!
Comments

Request Information From Our Sponsors
- StockCharts.com, Inc.
- Candle Patterns
- Candlestick Charting Explained
- Intermarket Technical Analysis
- John Murphy on Chart Analysis
- John Murphy's Chart Pattern Recognition
- John Murphy's Market Message
- MurphyExplainsMarketAnalysis-Intermarket Analysis
- MurphyExplainsMarketAnalysis-Visual Analysis
- StockCharts.com
- Technical Analysis of the Financial Markets
- The Visual Investor
- VectorVest, Inc.
- Executive Premier Workshop
- One-Day Options Course
- OptionsPro
- Retirement Income Workshop
- Sure-Fire Trading Systems (VectorVest, Inc.)
- Trading as a Business Workshop
- VectorVest 7 EOD
- VectorVest 7 RealTime/IntraDay
- VectorVest AutoTester
- VectorVest Educational Services
- VectorVest OnLine
- VectorVest Options Analyzer
- VectorVest ProGraphics v6.0
- VectorVest ProTrader 7
- VectorVest RealTime Derby Tool
- VectorVest Simulator
- VectorVest Variator
- VectorVest Watchdog
