HOT TOPICS LIST
- MACD
- Fibonacci
- RSI
- Gann
- ADXR
- Stochastics
- Volume
- Triangles
- Futures
- Cycles
- Volatility
- ZIGZAG
- MESA
- Retracement
- Aroon
INDICATORS LIST
LIST OF TOPICS
PRINT THIS ARTICLE
by David Penn
Technical signs of a breakdown in unleaded gas were abundant for those who watched closely.
Position: N/A
David Penn
Technical Writer for Technical Analysis of STOCKS & COMMODITIES magazine, Working-Money.com, and Traders.com Advantage.
PRINT THIS ARTICLE
REVERSAL
Gas Goes Down
04/10/03 12:27:25 PMby David Penn
Technical signs of a breakdown in unleaded gas were abundant for those who watched closely.
Position: N/A
| One exercise in critical thinking involves looking at an outcome and then going back to try and determine what factors might have allowed someone to anticipate that outcome in advance. While it is true that post hoc thinking has its limitations, if you believe that patterns exist in whatever it is that is being observed, then it is also true that studying those factors contributing to a certain pattern and outcome will give you a better probabilty of anticipating--from a risk/reward standpoint--those outcomes. This, for many, is the essence of technical analysis--in everything from tape reading to sophisticated trading algorithms. |
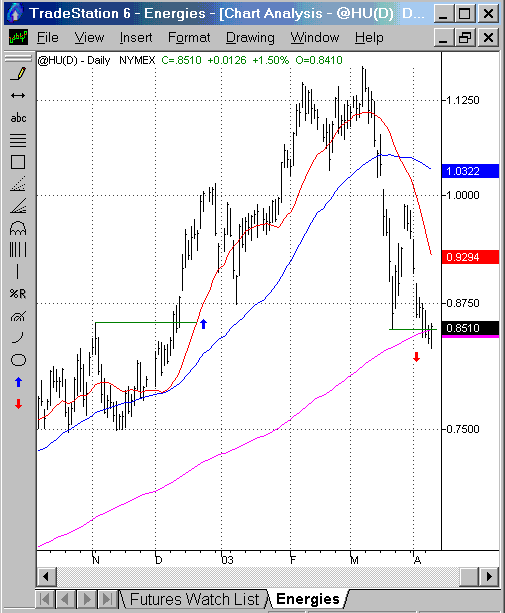
| I think of this looking at the charts of unleaded gasoline--particularly May unleaded gas (HUK03 or HUK3). Unleaded gasoline has been in a bull market since breaking out from a downwardly sloped consolidation in the second quarter of 2002. This move coincided also with gasoline moving up above its 50-day moving average. This 50-day moving average would prove to be a strong support line for gasoline; as its bull market unfolded, prices rarely dipped below the 50-day moving average. When they did, briefly, in November 2002, prices rallied strongly making another swing breakout in December. |

|
| Figure 1: After slipping beneath its 50-day moving average in November, gasoline made a strong swing move up in early December to resume the bullish trend. Note both the gap up early in the swing move, as well as the support this area provided during the short, sharp pullback early in January. |
| Graphic provided by: TradeStation. |
| |
| The first indication of a top comes in the failed 2B test of top in March 2003. After establishing a new contract high early in February, prices retreated, actually dipping beneath the 20-day moving average. Prices rallied to make a new contract high in early March, but there was no follow-through in support of the new high. The 2B test suggests that such an instance represents a good risk/reward opportunity on the short side for aggressive traders. |
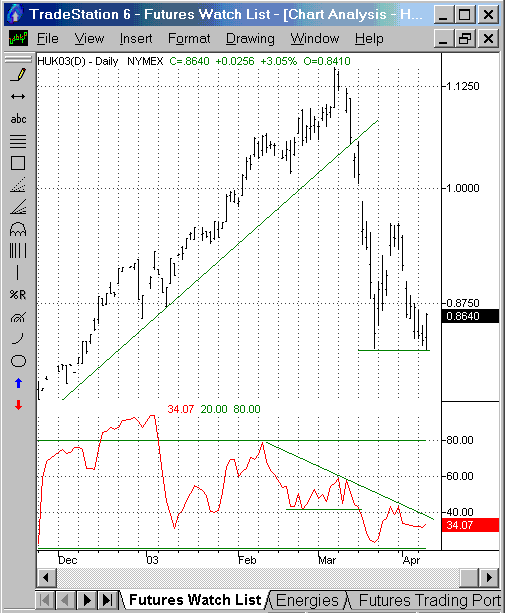
| Zooming in to the nearby contracts, such as the May contract, we get further indications of how the top developed. The next "sell signal" came in the form of the gap down beneath a four and a half month upward trendline. That this gap down in the May contract occurred coincident with the money flow index falling beneath its lowest level since mid-February is all the more significant--given that the money flow index had been in a downtrend certainly since early February. In fact, there was a sort of double gap down: an initial trendline break, followed by a second sharp gap down two days later. |
 Figure 2: A failed 2B test of top and a gap down beneath a major trendline lead to a possible bearish swing set-up in April. Note the sharply declining money flow indicator. May gasoline appears on the verge of another breakdown if support does not hold. Prices thus far have found support at a correction low of about 0.8300, where they rallied in late March to a high of 0.9600 before falling back to the 0.8300 level. This level is additionally significant because it is at approximately the same level as the swing breakout to the upside back in early December 2002 mentioned above. Additionally, as the chart of continuous gasoline futures shows, the 200-day moving average is at precisely the same level as the current swing support line. That suggests that a line of last support may indeed be forming at this level. Any breakdown beneath this level, should one occur, could be sharp and dramatic, possibly taking May gasoline down as low as 0.7000 in a further leg down. |
Technical Writer for Technical Analysis of STOCKS & COMMODITIES magazine, Working-Money.com, and Traders.com Advantage.
| Title: | Technical Writer |
| Company: | Technical Analysis, Inc. |
| Address: | 4757 California Avenue SW |
| Seattle, WA 98116 | |
| Phone # for sales: | 206 938 0570 |
| Fax: | 206 938 1307 |
| Website: | www.Traders.com |
| E-mail address: | DPenn@traders.com |
Traders' Resource Links | |
| Charting the Stock Market: The Wyckoff Method -- Books | |
| Working-Money.com -- Online Trading Services | |
| Traders.com Advantage -- Online Trading Services | |
| Technical Analysis of Stocks & Commodities -- Publications and Newsletters | |
| Working Money, at Working-Money.com -- Publications and Newsletters | |
| Traders.com Advantage -- Publications and Newsletters | |
| Professional Traders Starter Kit -- Software | |
Click here for more information about our publications!
Comments
Date: 04/12/03Rank: 3Comment:

Request Information From Our Sponsors
- StockCharts.com, Inc.
- Candle Patterns
- Candlestick Charting Explained
- Intermarket Technical Analysis
- John Murphy on Chart Analysis
- John Murphy's Chart Pattern Recognition
- John Murphy's Market Message
- MurphyExplainsMarketAnalysis-Intermarket Analysis
- MurphyExplainsMarketAnalysis-Visual Analysis
- StockCharts.com
- Technical Analysis of the Financial Markets
- The Visual Investor
- VectorVest, Inc.
- Executive Premier Workshop
- One-Day Options Course
- OptionsPro
- Retirement Income Workshop
- Sure-Fire Trading Systems (VectorVest, Inc.)
- Trading as a Business Workshop
- VectorVest 7 EOD
- VectorVest 7 RealTime/IntraDay
- VectorVest AutoTester
- VectorVest Educational Services
- VectorVest OnLine
- VectorVest Options Analyzer
- VectorVest ProGraphics v6.0
- VectorVest ProTrader 7
- VectorVest RealTime Derby Tool
- VectorVest Simulator
- VectorVest Variator
- VectorVest Watchdog
