HOT TOPICS LIST
- MACD
- Fibonacci
- RSI
- Gann
- ADXR
- Stochastics
- Volume
- Triangles
- Futures
- Cycles
- Volatility
- ZIGZAG
- MESA
- Retracement
- Aroon
INDICATORS LIST
LIST OF TOPICS
PRINT THIS ARTICLE
by David Penn
A long-term moving average threatens the index's spring rally.
Position: N/A
David Penn
Technical Writer for Technical Analysis of STOCKS & COMMODITIES magazine, Working-Money.com, and Traders.com Advantage.
PRINT THIS ARTICLE
MOVING AVERAGES
The S&P 500's 50-Week Lid
04/09/03 10:04:35 AMby David Penn
A long-term moving average threatens the index's spring rally.
Position: N/A
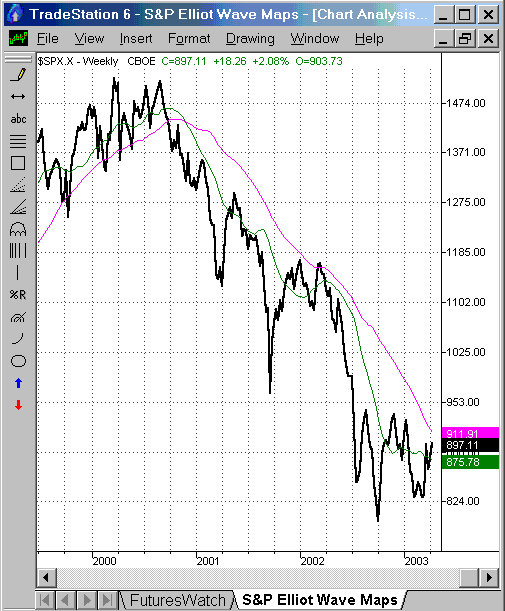
| Since breaking beneath its 50-week moving average in September 2000--and, even more decisively, since its 20-week moving average fell beneath its 50-week moving average two months later--the S&P 500 has closed above this long-term moving average only one time: during the spring of 2002 in the wake of what was then called the "September 11th Rally". Recall that the 9/11 rally saw the S&P 500 move from a September 2001 low of about 964 on a weekly closing basis to a high of 1174 in mid-March 2002. The actual high point of the rally, interestingly, was reached more than two months previous in the January 2002 rally peak of 1176. |
| But from September 2000 to March 2002, and again from April 2002 until the present, the S&P 500 has traded beneath this long-term moving average. As such, it has been an effective lid on stock prices for a year now, only recently threatened by the stock rally that anticipated the American and British-led invasion of Iraq. |

|
| The 50-week moving average of the S&P 500 remains a threat to any sustained market rally. Even breakouts above the 20-week moving average have been reason for caution. |
| Graphic provided by: TradeStation. |
| |
| Commentators watching the rally (a good many of whom--save the permabulls--were caught flat-footed, yours truly included) have been talking about various "moments of truth" for the current rally, up some 8% from the early March 2003 lows and rising. So far, for all its "shock and awe" (and, in many ways, this rally has been both) the S&P 500 has not taken out any of the previous rally peaks from August 2002, November 2002 or January 2003--the latter of which underscores the point that the S&P 500 is still in negative territory for the year. |
| The 50-week moving average line suggests why. This moving average--which has been an effective lid on any upward progress in the S&P 500 for two and a half years--once again looms over a rally in equity prices. As of April 7th, this moving average stood just shy of 912. When combined with the rally peaks mentioned above, it seems clear that formidable resistance awaits the S&P 500. |
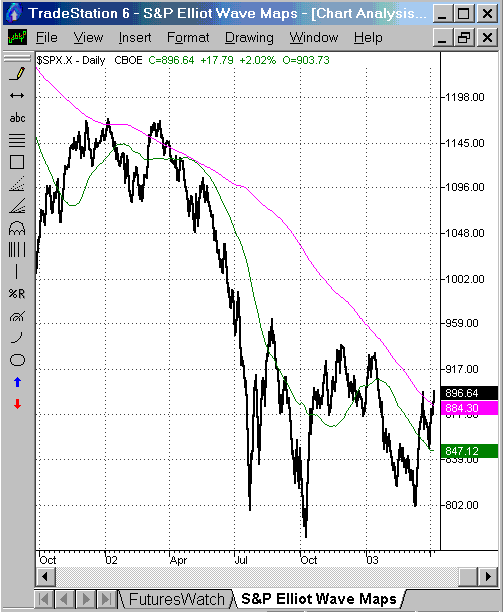
It is worth noting that the S&P 500 has moved above its 200-day moving average--albeit just barely as of the week beginning April 7th. The 200-day moving average is the more common long-term moving average used by investors and traders and that alone merits its inclusion and comparison here. It should also be said that the S&P 500 bested its 200-day moving average in the spring of 2002. The 200-day moving average has also provided resistance--albeit of a 'bend but don't break' variety--to the S&P's attempts to sustain an advance. |
Technical Writer for Technical Analysis of STOCKS & COMMODITIES magazine, Working-Money.com, and Traders.com Advantage.
| Title: | Technical Writer |
| Company: | Technical Analysis, Inc. |
| Address: | 4757 California Avenue SW |
| Seattle, WA 98116 | |
| Phone # for sales: | 206 938 0570 |
| Fax: | 206 938 1307 |
| Website: | www.Traders.com |
| E-mail address: | DPenn@traders.com |
Traders' Resource Links | |
| Charting the Stock Market: The Wyckoff Method -- Books | |
| Working-Money.com -- Online Trading Services | |
| Traders.com Advantage -- Online Trading Services | |
| Technical Analysis of Stocks & Commodities -- Publications and Newsletters | |
| Working Money, at Working-Money.com -- Publications and Newsletters | |
| Traders.com Advantage -- Publications and Newsletters | |
| Professional Traders Starter Kit -- Software | |
Click here for more information about our publications!
Comments
Date: 04/09/03Rank: 4Comment:
Date: 04/27/03Rank: 3Comment:

Request Information From Our Sponsors
- StockCharts.com, Inc.
- Candle Patterns
- Candlestick Charting Explained
- Intermarket Technical Analysis
- John Murphy on Chart Analysis
- John Murphy's Chart Pattern Recognition
- John Murphy's Market Message
- MurphyExplainsMarketAnalysis-Intermarket Analysis
- MurphyExplainsMarketAnalysis-Visual Analysis
- StockCharts.com
- Technical Analysis of the Financial Markets
- The Visual Investor
- VectorVest, Inc.
- Executive Premier Workshop
- One-Day Options Course
- OptionsPro
- Retirement Income Workshop
- Sure-Fire Trading Systems (VectorVest, Inc.)
- Trading as a Business Workshop
- VectorVest 7 EOD
- VectorVest 7 RealTime/IntraDay
- VectorVest AutoTester
- VectorVest Educational Services
- VectorVest OnLine
- VectorVest Options Analyzer
- VectorVest ProGraphics v6.0
- VectorVest ProTrader 7
- VectorVest RealTime Derby Tool
- VectorVest Simulator
- VectorVest Variator
- VectorVest Watchdog
