HOT TOPICS LIST
- MACD
- Fibonacci
- RSI
- Gann
- ADXR
- Stochastics
- Volume
- Triangles
- Futures
- Cycles
- Volatility
- ZIGZAG
- MESA
- Retracement
- Aroon
INDICATORS LIST
LIST OF TOPICS
PRINT THIS ARTICLE
by David Penn
An important test of support looms for the CRB Index now that its year-long bull market is over.
Position: N/A
David Penn
Technical Writer for Technical Analysis of STOCKS & COMMODITIES magazine, Working-Money.com, and Traders.com Advantage.
PRINT THIS ARTICLE
SUPPORT & RESISTANCE
Support and Commodities
04/08/03 09:43:50 AMby David Penn
An important test of support looms for the CRB Index now that its year-long bull market is over.
Position: N/A
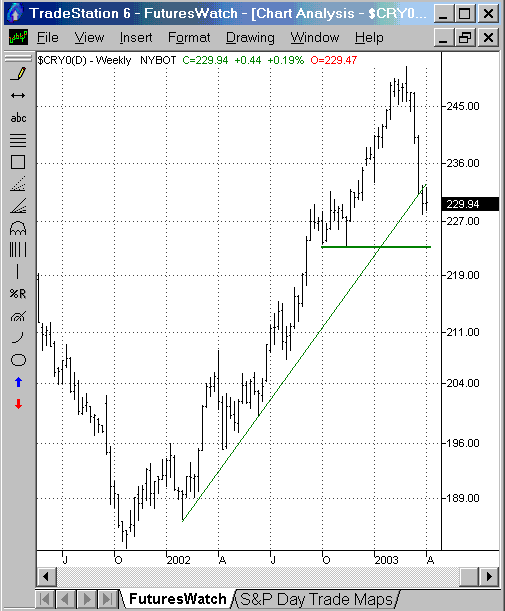
| Inasmuch as 2002 was a terribly bearish year for stocks, it was a splendidly bullish year for commodities. Bottoming in the fall of 2001, commodities as a whole (as measured by the CRB--Commodities Research Bureau--Index) spent the entirety of 2002 in a bullish mode, rising from just under 183 on the CRB Index in October 2001 to just over 250 by the spring of 2003. |
| However, March 2003 found the CRB Index moving swiftly into correction mode as the Index dropped from 251 in February to a low of about 228 in early April. This down move caused the CRB Index to break an upward trendline that extends back to the lows of late January 2002--still yet another signal that the bull market in commodities was ending. Importantly, the CRB Index now hovers over a support level left over from the October-November 2002 lows at about 223. Should the CRB index fail to remain above this support, the next support levels can be found significantly lower. These support levels include the early August 2002 low of 207, and the mid-June 2002 low of 200. |

|
| The bull market in commodities--as represented by the CRB Index--heads deeper into corrective mode. |
| Graphic provided by: TradeStation. |
| |
| Can the extent of the correction in the CRB Index be anticipated beyond these support levels? Fibonacci retracement levels provide clues for many and, in this case, suggest Fibonacci-support at the 38.2% retracement level of 225.32--which corresponds roughly to the major support level mentioned above--as well as possible support at the 50% retracement level of 217.21 and the 61.8% retracement level of 209.10. |
| The swing rule featured by Stan Weinstein ("Secrets for Profiting in Bull and Bear Markets") also provides some sense of where the current correction in the CRB Index may end up. The swing rule simply calls for measuring the distance between the peak of price action and a major support area and subtracting that amount from the value at the support area. Here in the case of the CRB Index, a distance of 27 is subtracted from the support area value of 223 to give us a downside "swing" target of 196. While steeper a decline than that suggested by any of the retracements suggested above, a correction to 196 would correspond almost exactly with a decline to the level of the mid-April 2002 lows. |
Technical Writer for Technical Analysis of STOCKS & COMMODITIES magazine, Working-Money.com, and Traders.com Advantage.
| Title: | Technical Writer |
| Company: | Technical Analysis, Inc. |
| Address: | 4757 California Avenue SW |
| Seattle, WA 98116 | |
| Phone # for sales: | 206 938 0570 |
| Fax: | 206 938 1307 |
| Website: | www.Traders.com |
| E-mail address: | DPenn@traders.com |
Traders' Resource Links | |
| Charting the Stock Market: The Wyckoff Method -- Books | |
| Working-Money.com -- Online Trading Services | |
| Traders.com Advantage -- Online Trading Services | |
| Technical Analysis of Stocks & Commodities -- Publications and Newsletters | |
| Working Money, at Working-Money.com -- Publications and Newsletters | |
| Traders.com Advantage -- Publications and Newsletters | |
| Professional Traders Starter Kit -- Software | |
Click here for more information about our publications!
Comments
Date: 04/27/03Rank: 3Comment:

Request Information From Our Sponsors
- StockCharts.com, Inc.
- Candle Patterns
- Candlestick Charting Explained
- Intermarket Technical Analysis
- John Murphy on Chart Analysis
- John Murphy's Chart Pattern Recognition
- John Murphy's Market Message
- MurphyExplainsMarketAnalysis-Intermarket Analysis
- MurphyExplainsMarketAnalysis-Visual Analysis
- StockCharts.com
- Technical Analysis of the Financial Markets
- The Visual Investor
- VectorVest, Inc.
- Executive Premier Workshop
- One-Day Options Course
- OptionsPro
- Retirement Income Workshop
- Sure-Fire Trading Systems (VectorVest, Inc.)
- Trading as a Business Workshop
- VectorVest 7 EOD
- VectorVest 7 RealTime/IntraDay
- VectorVest AutoTester
- VectorVest Educational Services
- VectorVest OnLine
- VectorVest Options Analyzer
- VectorVest ProGraphics v6.0
- VectorVest ProTrader 7
- VectorVest RealTime Derby Tool
- VectorVest Simulator
- VectorVest Variator
- VectorVest Watchdog
