HOT TOPICS LIST
- MACD
- Fibonacci
- RSI
- Gann
- ADXR
- Stochastics
- Volume
- Triangles
- Futures
- Cycles
- Volatility
- ZIGZAG
- MESA
- Retracement
- Aroon
INDICATORS LIST
LIST OF TOPICS
PRINT THIS ARTICLE
by Gary Grosschadl
This Canadian forest products company hit hard times as it is embroiled in the Canada-U.S. softwood lumber dispute.
Position: Buy
Gary Grosschadl
Independent Canadian equities trader and technical analyst based in Peterborough
Ontario, Canada.
PRINT THIS ARTICLE
CHART ANALYSIS
Tembec Inc. Bounces Off Three Year Low
04/07/03 01:03:56 PMby Gary Grosschadl
This Canadian forest products company hit hard times as it is embroiled in the Canada-U.S. softwood lumber dispute.
Position: Buy
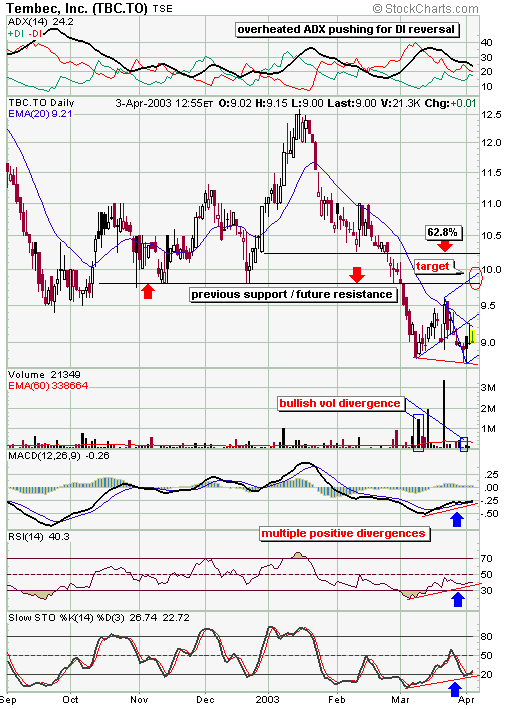
| Although talks appear to be badly stalled, this chart hints that some kind of optimism is in the air. The stock fell hard the past several months from $12.50 to $8.50. The chart doesn't care about politics, so what is it trying to tell us? |
| The chart has bullish promise via multiple positive divergences. When looking for turnaround situations, multiple divergences are often very reliable as they serve to give a weight of evidence that tilts the odds in a trader's favor. The volume pattern (similar to a double bottom) shows lower volume on this recent new low versus the low several weeks ago. This shows less conviction and less bearish power working on driving the stock further down. This is a bullish volume divergence. If the bears are spent, then the bulls can lift the stock higher. |

|
| 7 month daily chart |
| Graphic provided by: stockcharts.com. |
| |
| Several other bullish divergences are evident in the displayed indicators. The MACD (moving average convergence divergence) indicator, RSI (relative strength indicator) and the stochastics all show similar positive divergences to recent price action. While price has moved down, these indicators refused to do the same, showing apparent bullish intent. |
| How far the stock runs depends on how it handles initial resistance as depicted by the overhead 20-day EMA. This is also represented by the Andrews pitchfork (another way of showing support and resistance using pivot points). The pitchfork view shows a move from the lower median line to the middle median line where the stock backed off. To advance to higher levels, the stock must rise past the 20-day EMA and this median line. Looking at the ADX/DI at the top of the chart, otherwise known as the directional movement indicator, also tells a similar story. In order to make a bullish assault towards the upside target, the DI's need to do a bullish crossover. With +DI on top, the bulls gain power and pave the way for additional upside. |
| The upside target zone encompases three likely areas of resistance. The upper median line, the $10 psychological level and a previous support level likely turned into future resistance. Just above this target zone of $9.80 - $10, lies another resistance target ~ $10.20. This represents a Fibonacci retracement target of 62.8 % (between the high and low of the chart). Note how this also corresponds to the bottom of a large previous candlestick (late 2002) giving additional credence to this level. A move down that violates the lower median line is the downside risk to traders assuming a long position and negates the bullish scenario. |
Independent Canadian equities trader and technical analyst based in Peterborough
Ontario, Canada.
| Website: | www.whatsonsale.ca/financial.html |
| E-mail address: | gwg7@sympatico.ca |
Click here for more information about our publications!
PRINT THIS ARTICLE

|

Request Information From Our Sponsors
- StockCharts.com, Inc.
- Candle Patterns
- Candlestick Charting Explained
- Intermarket Technical Analysis
- John Murphy on Chart Analysis
- John Murphy's Chart Pattern Recognition
- John Murphy's Market Message
- MurphyExplainsMarketAnalysis-Intermarket Analysis
- MurphyExplainsMarketAnalysis-Visual Analysis
- StockCharts.com
- Technical Analysis of the Financial Markets
- The Visual Investor
- VectorVest, Inc.
- Executive Premier Workshop
- One-Day Options Course
- OptionsPro
- Retirement Income Workshop
- Sure-Fire Trading Systems (VectorVest, Inc.)
- Trading as a Business Workshop
- VectorVest 7 EOD
- VectorVest 7 RealTime/IntraDay
- VectorVest AutoTester
- VectorVest Educational Services
- VectorVest OnLine
- VectorVest Options Analyzer
- VectorVest ProGraphics v6.0
- VectorVest ProTrader 7
- VectorVest RealTime Derby Tool
- VectorVest Simulator
- VectorVest Variator
- VectorVest Watchdog
