HOT TOPICS LIST
- MACD
- Fibonacci
- RSI
- Gann
- ADXR
- Stochastics
- Volume
- Triangles
- Futures
- Cycles
- Volatility
- ZIGZAG
- MESA
- Retracement
- Aroon
INDICATORS LIST
LIST OF TOPICS
PRINT THIS ARTICLE
by David Penn
A failed 2B test of top leads to a head and shoulders breakdown in June hogs.
Position: N/A
David Penn
Technical Writer for Technical Analysis of STOCKS & COMMODITIES magazine, Working-Money.com, and Traders.com Advantage.
PRINT THIS ARTICLE
HEAD & SHOULDERS
Is the Pig Party Over?
04/04/03 01:18:53 PMby David Penn
A failed 2B test of top leads to a head and shoulders breakdown in June hogs.
Position: N/A
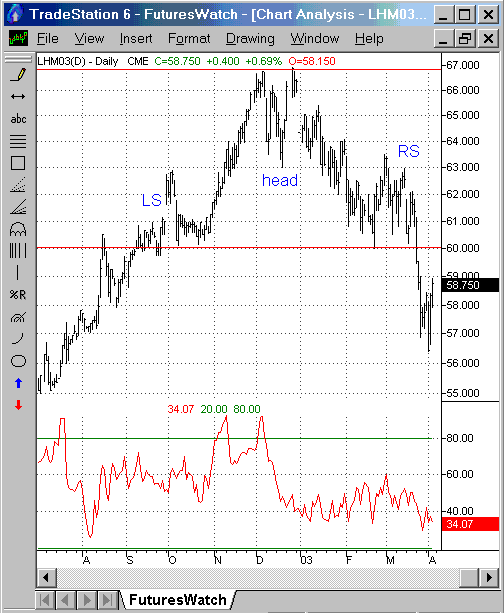
| The first sign that the lean hogs bull market was over came in the form of a failed 2B test of top in November-December 2002. As I have written before, the 2B test of top comes when prices make a new high, pull back, and then make a higher high. If prices fail to follow-through on the upside after the new higher high, then the 2B test of top is said to fail and prices may be reasonably expected to retreat. |
| Just such a failed test of top occurred in the June lean hog contract in November and December of 2002. June hogs emerged from a consolidation in September-October 2002 to make a new contract high of 66.750 in December. From this peak, June hogs pulled back somewhat to a resistance-turned-support level of around 63 by mid-month. June hogs rallied from this support to make a new, higher contract high of 66.900 on December 26, 2003. |

|
| The money flow indicator shows buyers leaving June lean hogs nearly a month before the 2B test in late December. The head and shoulders top confirms the reversal of trend. |
| Graphic provided by: TradeStation. |
| |
| However, there was no upside follow-through on this new, higher high. In fact, after two days of lower closes, June hogs actually gapped down--a strong indication that buying interest had subsided. From the gap down area of about 64.50 in early January 2003, June lean hogs fell to 62.550 by the beginning of February before consolidating in a range between 63 and 60. |
| At the end of March, June lean hogs broke down beneath support at 60, falling as low as 56.400 before bouncing somewhat in early April. As the chart of June lean hogs reveals, the support level at 60 also demarks the neckline for a head and shoulders top. This head and shoulders top consists of a left shoulder in the price action from September 2002 to late October 2002, a head in the price action from November 2002 to February 2003, and a right shoulder in the price action from mid-February to mid-March 2003. The size of the head and shoulders top--measured from the December 2002 peak just shy of 67 to the neckline support at 60--suggests that June lean hogs could fall as low as 53 in an initial leg down. Interestingly, a decline to these levels would likely close the gap that was formed back in late June 2002, a bullish gap that led to the six and a half month bull market. |
Technical Writer for Technical Analysis of STOCKS & COMMODITIES magazine, Working-Money.com, and Traders.com Advantage.
| Title: | Technical Writer |
| Company: | Technical Analysis, Inc. |
| Address: | 4757 California Avenue SW |
| Seattle, WA 98116 | |
| Phone # for sales: | 206 938 0570 |
| Fax: | 206 938 1307 |
| Website: | www.Traders.com |
| E-mail address: | DPenn@traders.com |
Traders' Resource Links | |
| Charting the Stock Market: The Wyckoff Method -- Books | |
| Working-Money.com -- Online Trading Services | |
| Traders.com Advantage -- Online Trading Services | |
| Technical Analysis of Stocks & Commodities -- Publications and Newsletters | |
| Working Money, at Working-Money.com -- Publications and Newsletters | |
| Traders.com Advantage -- Publications and Newsletters | |
| Professional Traders Starter Kit -- Software | |
Click here for more information about our publications!
PRINT THIS ARTICLE

|

Request Information From Our Sponsors
- StockCharts.com, Inc.
- Candle Patterns
- Candlestick Charting Explained
- Intermarket Technical Analysis
- John Murphy on Chart Analysis
- John Murphy's Chart Pattern Recognition
- John Murphy's Market Message
- MurphyExplainsMarketAnalysis-Intermarket Analysis
- MurphyExplainsMarketAnalysis-Visual Analysis
- StockCharts.com
- Technical Analysis of the Financial Markets
- The Visual Investor
- VectorVest, Inc.
- Executive Premier Workshop
- One-Day Options Course
- OptionsPro
- Retirement Income Workshop
- Sure-Fire Trading Systems (VectorVest, Inc.)
- Trading as a Business Workshop
- VectorVest 7 EOD
- VectorVest 7 RealTime/IntraDay
- VectorVest AutoTester
- VectorVest Educational Services
- VectorVest OnLine
- VectorVest Options Analyzer
- VectorVest ProGraphics v6.0
- VectorVest ProTrader 7
- VectorVest RealTime Derby Tool
- VectorVest Simulator
- VectorVest Variator
- VectorVest Watchdog
