HOT TOPICS LIST
- MACD
- Fibonacci
- RSI
- Gann
- ADXR
- Stochastics
- Volume
- Triangles
- Futures
- Cycles
- Volatility
- ZIGZAG
- MESA
- Retracement
- Aroon
INDICATORS LIST
LIST OF TOPICS
PRINT THIS ARTICLE
by Gary Grosschadl
Friday was a big day for most gold stocks and the various gold indexes.
Position: Buy
Gary Grosschadl
Independent Canadian equities trader and technical analyst based in Peterborough
Ontario, Canada.
PRINT THIS ARTICLE
CHART ANALYSIS
Gold Tries Again
04/02/03 02:35:32 PMby Gary Grosschadl
Friday was a big day for most gold stocks and the various gold indexes.
Position: Buy
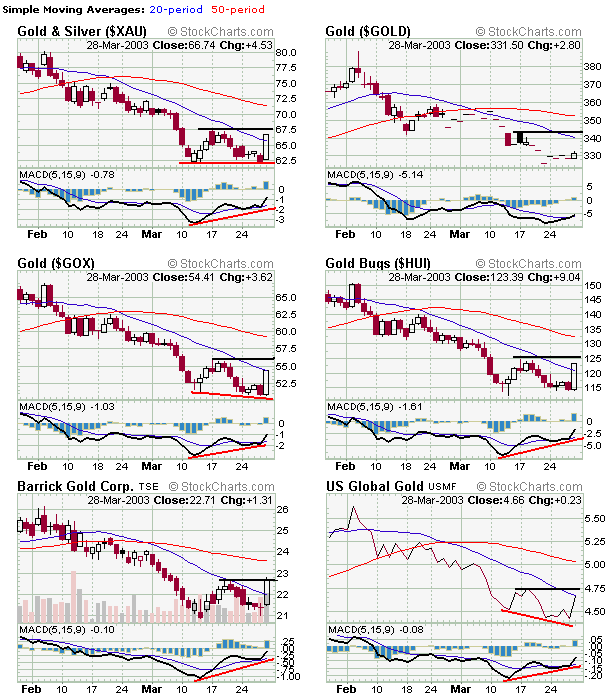
| Friday's action on the daily charts below show the biggest single up day during the past two months. It is likely that the major factors behind this are that the price of gold has come down to an apparently strong support level of $325 (successful test) and the perception / realization of prolonged engagement in Iraq (increased geopolitcal risk). |
| From a technical point of view this latest bounce was accompanied by at least one sign of positive divergence, that being between price action and the MACD (moving average convergence divergence). As prices came down to previous lows or near lows, the MACD did not follow, giving the liklihood of an upleg to follow. The immediate resistance levels are shown on these daily charts. To avoid stall danger, these levels have to be surpassed in the days ahead and then show signs of resistance turning to support. Failure here negates any early buy signal for aggressive short term traders. Stop losses set just below respective 20-day EMA would be advisable for those trading an early move here. The grey area being a slight balk here before moving higher so stops should be set according to one's tolerance for risk. An interesting observation is that Barrick Corp. (ABX.to) seems to be ahead of the pack here as it already is at it's previous short term high near $22.80. |

|
| Fig. 1 shows a collage of daily gold charts |
| Graphic provided by: stockcharts.com. |
| |
| The gold spot price has managed to rise back above $330 (closed at 331.50) after coming down to a low of $325. The spot price really needs to rise above the $340-345 to show some conviction there is a sustainable move back up to challenge that $350 level of previous support. |
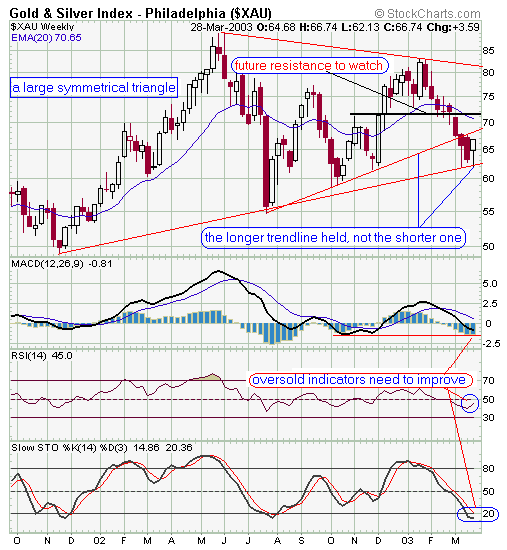
Switching to the longer term view, the second chart shows the weekly XAU gold index. Here you see an 18-month symmetrical triangle, considered a neutral pattern until a trendline breaks with conviction. Things looked bleak for the gold bugs as a shorter term trendline was breached but as the chart shows, support (for now) was found at the longer term trendline around the 62 level. The temptation call here is whether or not there continues a successful bullish drive to the upper trendline. I am suggesting that in order for this to occur, the first real resistance test may lie near the 20 period EMA around 70-72. A move above this level could result in a launch pad further north as this 20 period EMA becomes a possible base of support. Figure 2: Weekly chart of the XAU gold index. |
| In summary watch these initial resistance levels as a guide to whether early failure/stall occurs or sustainable drive to higher levels ensues. Note the 50 period EMA line on the small daily charts. These could be the next upside tests beyond these initial short term resistance levels. |
Independent Canadian equities trader and technical analyst based in Peterborough
Ontario, Canada.
| Website: | www.whatsonsale.ca/financial.html |
| E-mail address: | gwg7@sympatico.ca |
Click here for more information about our publications!
Comments
Date: 04/15/03Rank: 3Comment:

Request Information From Our Sponsors
- StockCharts.com, Inc.
- Candle Patterns
- Candlestick Charting Explained
- Intermarket Technical Analysis
- John Murphy on Chart Analysis
- John Murphy's Chart Pattern Recognition
- John Murphy's Market Message
- MurphyExplainsMarketAnalysis-Intermarket Analysis
- MurphyExplainsMarketAnalysis-Visual Analysis
- StockCharts.com
- Technical Analysis of the Financial Markets
- The Visual Investor
- VectorVest, Inc.
- Executive Premier Workshop
- One-Day Options Course
- OptionsPro
- Retirement Income Workshop
- Sure-Fire Trading Systems (VectorVest, Inc.)
- Trading as a Business Workshop
- VectorVest 7 EOD
- VectorVest 7 RealTime/IntraDay
- VectorVest AutoTester
- VectorVest Educational Services
- VectorVest OnLine
- VectorVest Options Analyzer
- VectorVest ProGraphics v6.0
- VectorVest ProTrader 7
- VectorVest RealTime Derby Tool
- VectorVest Simulator
- VectorVest Variator
- VectorVest Watchdog
