HOT TOPICS LIST
- Strategies
- Stocks
- Buy
- Investing
- Brokers
- Psychology
- Interviews
- Accumulate
- Sell
- Hold
- Spotlight
- Websites
- Candlestick Corner
- Gold & Metals
- Options Trading
LIST OF TOPICS
INTERMARKET ANALYSIS
Airlines & Oil
01/25/06 02:04:23 PM PSTby David Penn
The same stuff that makes airplanes go up makes their stocks go up... and down
| Writing about intermarket technical analysis in his book Intermarket Technical Analysis, author and trader John Murphy concluded:
Intermarket analysis represents another step in the evolution of technical theory. With the growing recognition that all markets are linked — financial and non-financial, domestic and international — traders will be taking these linkages into consideration more and more in their analysis. Because of the flexibility and its universal application to all markets, technical analysis is uniquely suited to perform this type of analysis. (Emphasis original.)
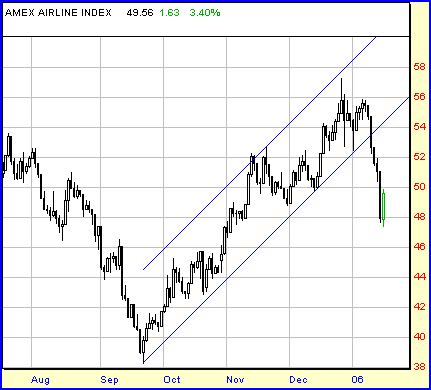
Murphy's book does an excellent job of noting the intermarket relationships between oil and oil stocks, gold and gold mining shares — even the relationships between money center banks, savings and loans, and bonds are clarified in his eye-opening analysis. What is most rewarding about Murphy's observations is that they, as the excerpt suggests, are very much the gift that keeps on giving. Uncovering one intermarket relationship often opens the door to discovering others. For example, at one level intermarket relationships can illuminate the tendency of commodity stocks (such as oil stocks or gold mining shares) to lead the underlying commodity. At another level, however, we can look at the performance of commodity-sensitive stocks relative to the commodity that plays a key role in that industry or sector. A perfect example of this might be the relationship between the price of crude oil and the movement of airlines stocks. In 2005 we saw a strong rally out of the autumn lows, one that was led in many ways by the airlines stocks (see Figure 1).
Figure 1: AMEX Airlines Index, Daily. Airline stocks were among those first to make their seasonal lows in the autumn of 2005. Their weakness in early 2006 anticipated weakness in the broader market.
That airline stocks might lead an expansion is no intermarket analytic breakthrough. Since the earliest days of Dow theory, there has been recognition of the key role that transportation stocks — rails then, airlines now — play in signaling an uptick in business activity. Nevertheless, it is worthwhile to study what happened in the autumn of 2005 in the hopes that traders and speculators will be better able to spot similar developments as they occur in the future.
AIRLINES TAKE OFF
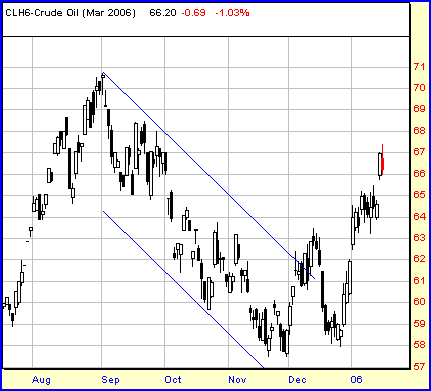
Figure 2: March Crude Oil Futures, Daily. The sharp correction in crude oil provided the impetus for the advance in airline shares. However, a rebound in crude oil prices in December 2005 and January 2006 helped mark the end.
Even though contemporary airline companies tend to be hedged against rises in crude oil prices, these hedges tend to be partial in the airline industry. And there's no doubt — hedge or no hedge — that any ease in crude oil prices would contribute positively toward the bottom line for these companies. That expectation is what drove the shares of airlines higher in October and November 2005, and contributed toward the broader bottom in stocks overall (the $XAL bottomed in September while the Standard & Poor's 500, NASDAQ, and Dow industrials all bottomed in October). As measured by the $XAL, airlines stocks began running into turbulence in the second half of December. Internal technicals told this tale. Not only was there a month-on-month negative divergence in the stochastic (November peak to December peak) for $XAL, but the December peak was crowned with a particularly bearish candlestick pattern known as the shooting star which, after a period of advancing prices, tends to augur a loss of upside momentum. In the month since that shooting star pattern appeared in $XAL, the index has fallen from over 55 to under 48 — with stocks like JetBlue, Alaska Air, and Continental Airlines losing anywhere from 20% to 30% of their value. ALL ABOUT THE OIL The behavior of airline stocks during oil's recent correction makes that conceit appear all the more suspect. Even the bounce in crude oil from mid-November to mid-December occasioned a temporary respite in the $XAL's September-through-December rally. Oil signaled an end to its summer rally in mid-August with a clear and distinct negative stochastic divergence — one that was actually confirmed by a negative divergence in the MACDH (moving average convergence/divergence histogram). Over the course of September, crude oil moved into a sideways, diamond-shaped consolidation. But by October, the correction had resumed, sending crude oil (basis March 2006) from over $70 in late August to under $58 by late November. (See my "Crude's Cracked Wall Of Worry," Traders.com Advantage, August 30, 2005, for more analysis of the August top.) As I wrote for Traders.com Advantage ("Is Crude Oil Ready To Run?" October 18, 2005), the move down in crude oil over the autumn of 2005 was likely to prove a temporary phenomenon. Aside from the notion that crude oil is in a secular bull market (the opposite of the secular bear market that crude oil had suffered through for most of the 1980s and 1990s), crude oil had created a number of positive stochastic and MACDH divergences during its autumn descent. The abundance of positive divergences suggested a substantial waning of selling strength, and the potential for a powerful move back to the upside on the occasion that these positive divergences were confirmed by follow-through price action to the upside. This confirmation began in November as crude oil rallied from the $58 level, creating a sizable, positive MACDH peak in December, and was completed with the higher low in the second half of December. In less than two months, crude oil had rallied from $58 to over $65, retracing fully 61.8% of its decline from the August peak. ARE YOU GONNA GO MY WAY? The idea that stocks still have a bias to the downside may seem strange, given the cyclical upswing since the 2002 lows. But for now, and until new all-time highs are reached in the Standard & Poor's 500 or NASDAQ, I'm comfortable with the assumption that the current cyclical bull market is akin to those cyclical bull markets that occurred during the secular bear markets of 192942, 196674, and 197482. In each of these four significant rallies in the airlines index — September 2001 through March 2002, the rally from March 2003 through October 2003, the rally from October 2004 through December 2004, and the rally from September 2005 through December 2005 — crude oil prices initially "supported" the early rally in stocks but eventually regained their own bullish bias. (See Figure 3.)
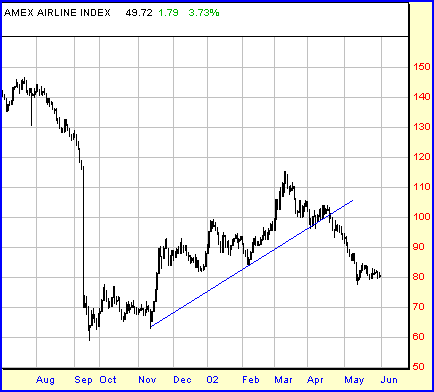
Figure 3: AMEX Airlines Index, Daily. After the major terrorist attacks in the United States in September 2001, airline stocks joined the broader market in rallying sharply throughout the balance of 2001 and into the new year.
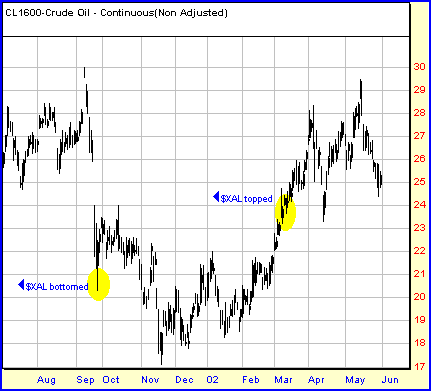
As the $XAL rose, crude oil prices fell for approximately two months and then began to move higher. In the first instance, $XAL bottomed in late September 2001, and rallied until March 2002. (See Figure 4.) During the SeptemberNovember portion of the $XAL's rally, oil prices continued to fall. However, during the DecemberMarch portion of $XAL's rally, oil prices had begun to move higher — and would continue to do so after the $XAL topped out in the spring of 2002.
Figure 4: Crude Oil, Continuous Futures, Daily. Crude oil continued to fall as airlines stocks bottomed in late September 2001, but began moving higher by year's end and continued moving higher in the spring of 2002.
In the second instance, $XAL rallied well into the autumn of 2003 after bottoming in March of that year. Crude oil futures fell for the first two months of that rally — bottoming in May 2003 — before resuming a bullish trend of, if not higher highs, then certainly higher lows. The bullish trend in crude oil would continue on after the $XAL peaked in October. Crude's new relative highs in early 2004 contrasted sharply with the $XAL's new relative lows. (See Figure 5.)
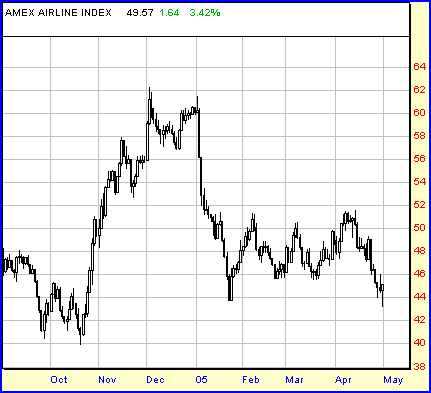
Figure 5: AMEX Airlines Index, Daily. Even shorter-term movements such as this three-month rally are influenced by the behavior of other factors — such as a bottom and subsequent rally in crude oil, which ended $XAL's rally in late 2004.
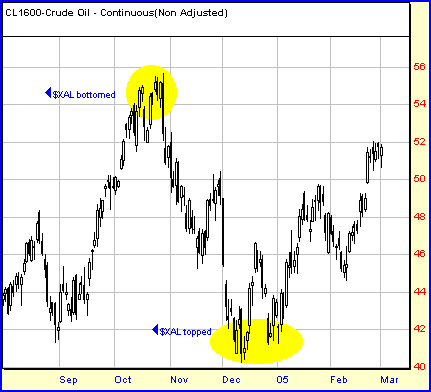
In October 2004, crude oil prices fell from October to December, and began rallying just as the $XAL was topping in over the course of December. Finally, crude oil prices — as mentioned earlier — topped in September 2005 just as airline stocks were beginning to get bids. Airline stocks continued to advance into December, but reversed and began to decline just as crude oil futures were getting bids in earliest 2006. What is the pattern? It appears as if airline stocks have managed to move higher, particularly during periods when there is softness in the crude oil price. This isn't a completely inverse relationship. In the first two examples here, crude oil prices continued to correct for about two months while the airline stocks established bottoms and began to move higher. For a period of time — four months in the first example from September 2001 through March 2002 and five months in the second example from March 2003 through October 2003 — both crude oil and the $XAL were rising. However, in both instances that period would give way after a period of time, with crude oil prices continuing to advance while the $XAL corrected. In the third example of October 2004 through December 2004, crude oil prices fell during that period, yet when crude oil began to move higher in early 2005, the airlines stocks did not follow. (See Figure 6.)
Figure 6: Crude Oil, Continuous Futures, Daily. At times the relationship between crude oil and airline stocks during the secular bull market in the former and the secular bear market in the latter is almost perfectly inverse — as was the case with those markets late in 2004 and early in 2005.
As far as the fourth example, the jury is out. The year-end rally in 2005 is in many ways reminiscent of the year-end rally in 2004, which only encourages speculation that the airline stock/crude oil relationship will be similar. A similar outcome would have crude oil bottoming in December and moving up over the next few months while the $XAL corrected and moved lower going into early 2006. Context is important. Regardless of the specific relationship between crude oil and airlines stocks, the fact that crude oil is in a secular bull market while stocks remain in a secular bear market means that oil will be going up most of the time while stocks will be going down most of the time. So finding instances in which stocks are moving at cross-purposes with crude oil is no great feat. However, the timing of these crosses can make all the difference for investors, speculators, and traders looking for opportunities to join bull markets (and leave or short bear markets) as early as possible. And with intermarket technical analysis, traders can add another tool to their arsenal of technical indicators that will better enable them to anticipate sooner and confirm more thoroughly the very deliberate moves of the markets.
David Penn may be reached at DPenn@Traders.com. SUGGESTED READING Current and past articles from Working Money, The Investors' Magazine, can be found at Working-Money.com. ‡Charts courtesy of Prophet Financial Systems, Inc.
|
Technical Writer for Technical Analysis of STOCKS & COMMODITIES magazine, Working-Money.com, and Traders.com Advantage.
| Title: | Traders.com Technical Writer |
| Company: | Technical Analysis, Inc. |
| Address: | 4757 California Avenue SW |
| Seattle, WA 98116 | |
| Phone # for sales: | 206 938 0570 |
| Fax: | 206 938 1307 |
| Website: | www.traders.com |
| E-mail address: | DPenn@traders.com |
Traders' Resource Links | |
| Charting the Stock Market: The Wyckoff Method -- Books | |
| Working-Money.com -- Online Trading Services | |
| Traders.com Advantage -- Online Trading Services | |
| Technical Analysis of Stocks & Commodities -- Publications and Newsletters | |
| Working Money, at Working-Money.com -- Publications and Newsletters | |
| Traders.com Advantage -- Publications and Newsletters | |
| Professional Traders Starter Kit -- Software | |
PRINT THIS ARTICLE

|

Request Information From Our Sponsors
- VectorVest, Inc.
- Executive Premier Workshop
- One-Day Options Course
- OptionsPro
- Retirement Income Workshop
- Sure-Fire Trading Systems (VectorVest, Inc.)
- Trading as a Business Workshop
- VectorVest 7 EOD
- VectorVest 7 RealTime/IntraDay
- VectorVest AutoTester
- VectorVest Educational Services
- VectorVest OnLine
- VectorVest Options Analyzer
- VectorVest ProGraphics v6.0
- VectorVest ProTrader 7
- VectorVest RealTime Derby Tool
- VectorVest Simulator
- VectorVest Variator
- VectorVest Watchdog
- StockCharts.com, Inc.
- Candle Patterns
- Candlestick Charting Explained
- Intermarket Technical Analysis
- John Murphy on Chart Analysis
- John Murphy's Chart Pattern Recognition
- John Murphy's Market Message
- MurphyExplainsMarketAnalysis-Intermarket Analysis
- MurphyExplainsMarketAnalysis-Visual Analysis
- StockCharts.com
- Technical Analysis of the Financial Markets
- The Visual Investor

