HOT TOPICS LIST
- Strategies
- Stocks
- Buy
- Investing
- Brokers
- Psychology
- Interviews
- Accumulate
- Sell
- Hold
- Spotlight
- Websites
- Candlestick Corner
- Gold & Metals
- Options Trading
LIST OF TOPICS
WAVE THEORY
Forecasting Markets With Elliott And Kondratieff
09/15/05 02:34:29 PM PSTby Jacob Singer
Wave cycles may send you to the future or back to the drawing board.
It is difficult to forecast... especially the future.
I have this quote taped up above my computer screen, and I can't help but read it every morning. And yet, in spite of its message, I try to forecast the direction of the indexes, using either Elliott wave theory or Gann analysis, or a combination of both. On June 7, 2005, I presented a positive forecast for the Dow Jones Industrial Average (DJIA) on Traders.com Advantage, even though the title, "The Demise Of The Dow," could have been misleading. I based that particular forecast on a quote taken from Canada's National Post newspaper:
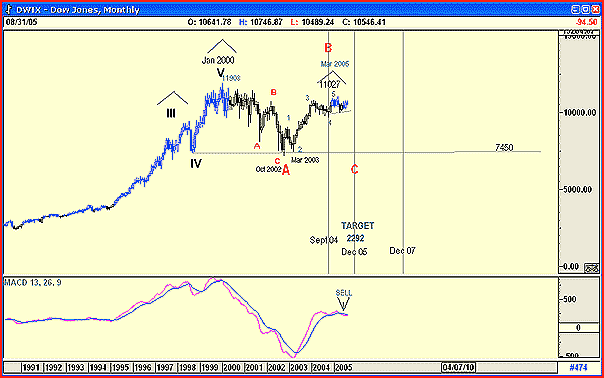
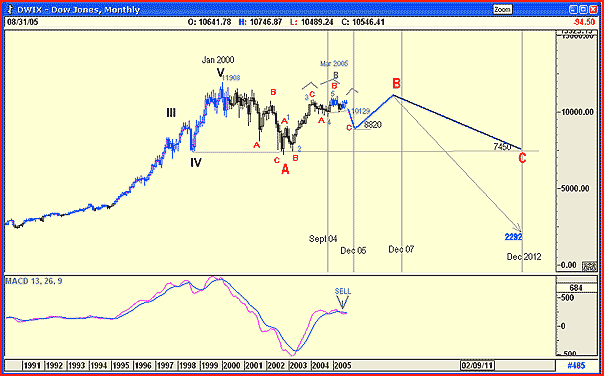
As it turns out, the Post was, oh, so wrong. Since that date, the US economy strengthened to the extent that on August 9, the Federal Reserve raised the key interest rate by 0.25 basis points. The Fed believes the US economy is strengthening, and inflation could become a serious threat. If this truly is what the Federal Reserve believes, then why does the Dow look as though it could be forming a head & shoulders pattern with a downside target of 2292 (see Figure 1)?
Figure 1: Elliott wave projection of the monthly chart of the DJIA.
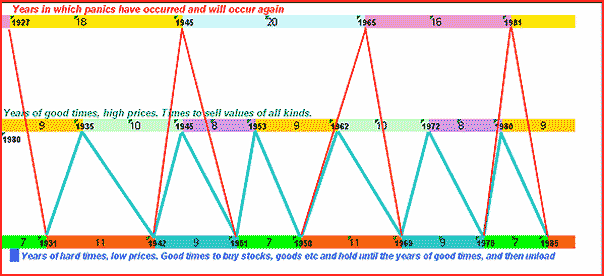
A look at Figure 1, the Elliott wave monthly chart of the Dow, suggests that a wave B upward may be forming. The pattern being traced by the DJIA, possibly the top of wave B, looks as if it could be the right shoulder of that head & shoulders pattern, with the neckline at 7450. With the high of January 2000 at 11908 and the neckline at 7450, the target for the demise of the DJIA could well be 2992. (11908 7450 = 4458; 7450 4458 = 2992.) However, this target does seem far too low. Can you imagine the DJIA falling 74.87% from the high in January 2000? I can't, and I don't even wish to consider it. Once again, the words of Samuel Goldwyn remind me exactly how difficult it is to forecast the future. It is far easier to look around for an alternative, and there is none better than the rule of the Elliott wave theory: "An ABC correction will correct to the fourth wave of lesser degree." This means that the DJIA should not fall farther than 7450. However, in The Elliott Wave Principle by AJ Frost and Robert Prechter, there is a chart (Figure 93 in my copy of the book) showing exactly how and explaining why a fall below the fourth wave of lesser degree can occur. The book suggests that "on the other side of the coin, a Dow theory nonconfirmation can often alert the Elliott theorist to examine his count" With this in mind, I recall the beauty of wave theory. I have always believed that the Elliott wave forecast is not cast in stone. Instead, it is a signpost suggesting, not confirming, a future move of the index or security to which it has been applied. A good wave technician will always have an alternate count in his or her back pocket, and be very quick to produce it when necessary. As President Harry Truman once said, "I have yet to meet a one-handed economist." The same can be said of an Elliott wave theorist. Figure 1 is my suggested count with future projections of where the DJIA will travel. In it, I show that the DJIA should not break below 7450 in its completion of wave C down. Of course, I could be wrong, and what I have labeled B in bright red could be wave I with the red C not falling below 7450 and becoming wave II of a major bull trend upward. With Goldwyn's words in front of me every morning as I switch on my computer, and with further reading into Frost and Prechter's book, I decided to look at the Kondratieff wave (K-wave) and see how it relates to the past and future movement of the DJIA. Nikolai Kondratieff first quantified the 50- to 60-year wave cycle that bears his name at the beginning of the 20th century. Elliott Wave Principle gives an interesting chart of the Kondratieff wave up until 1980 and, with the availability of the Internet, we can easily study numerous K-wave webpages with their respective charts and forecasts. I, however, have my own K-wave chart — one I found in 1982 and that has served me well over the years. (See Figure 2.)
Figure 2: My original Kondratieff chart, 1927 to 1985.
Without repeating any details that can easily be found on the web, I would like to point out the following: · Note the time scale for the different levels shown in the chart.
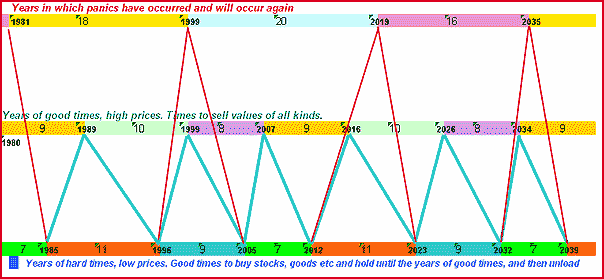
At the time I found it, the K-wave chart did not forecast beyond 1985. As you see in Figure 3, I have extended it into the 21st century, projecting the chart into the future.
Figure 3: The original Kondratieff chart projected through to 2039.
The chart starts in 1985 and moves forward through time to the year 2039. Points to note are: · The projected chart correctly called for a top in 1999 (it happened in January 2000).
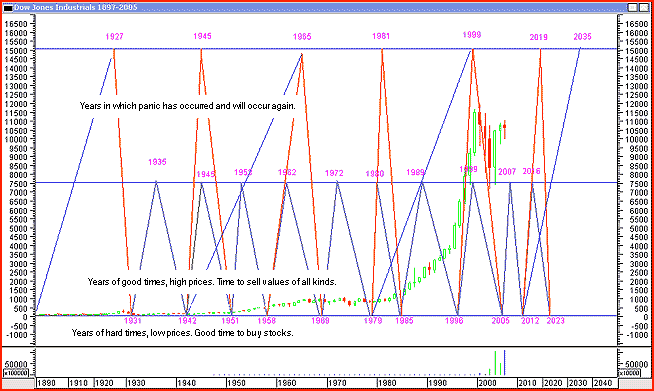
We are now in 2005, so the questions are on everyone's lips: "Has the Dow already bottomed in 2005?" "Is it starting, or has it already started the move into 2007?" "Could a double bottom form before the start of the move into 2007?" To resolve these questions, we must analyze the monthly chart of the DJIA with that of the K-wave. In Figure 4, I have superimposed the K-wave on top of the Dow, starting from 1890 and continuing to the present.
Figure 4: An arithmetic chart of the Dow, superimposed on the K-Wave, and showing the Dow's peak with the K-wave in1999/2000.
Figure 4 is an arithmetic chart of the DJIA showing how the Dow peaked with the K-wave in 1999-2000. The chart shows how the Dow fell in 2002 to 2003 and is now rising, possibly into 2007. How accurate is this forecast? Refer back to the monthly chart in Figure 1 (as it is easier to read) and note that it shows the following: · Wave V of the bull run topped out in January 2000 — the bursting of the bubble.
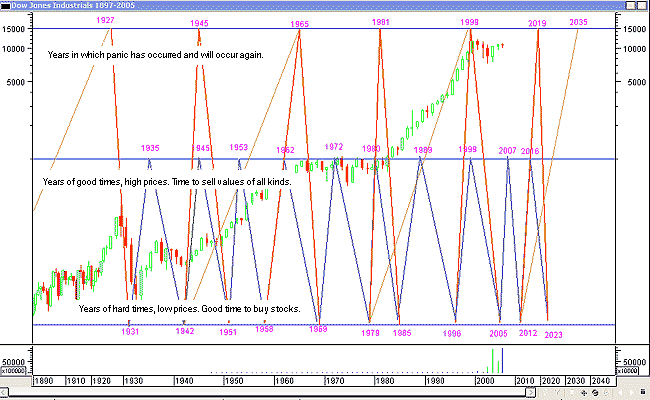
Because of this fearsome possibility — that is, a major collapse to 2292 — I redrew the K-wave correlation in semilog format, so I could study it in greater depth. Figure 5 shows the K-wave displaying the past and the projected future.
Figure 5: A semi-log of the Dow superimposed on the K-wave, displaying the past and the projected future.
Note the following: · The K-wave top in 1927 is correct, and the market fell in what became the Great Depression. In Figure 6, I have shown my forecast based on the semilog Kondratieff chart in Figure 5. Here, you see the top of wave B as a larger red B occurring sometime in 2007, to be followed by a wave C that could bottom in 2012 at 7450, forming a triple bottom.
Figure 6: The author's forecast, based on the semi-log Kondratieff chart in Figure 5.
I could be far too optimistic and too bullish in this forecast for the next two years, and far too bearish for 2007 to 2012, but based on the correlation with the K-wave, this projection does look feasible. Note the following in Figure 6: · The DJIA does appear to be forming a minor head & shoulders pattern consistent with an Elliott wave 3-4-5-ABC pattern. This suggests a target of 8820 should the Dow What could be wrong with this forecast? Everything! As all investors know, past performance is not indicative of future performance. On the other hand, the K-wave seems to have done a pretty good job of predicting the future. Based on the scenarios described, it is possible that, for the short term, the market could fall dramatically into the end of 2005 and the top of the wave B has already formed, with the end of the wave C occurring sometime early in 2006. However, the arithmetic chart in Figure 4 suggests otherwise. Remember how the Dow met the low at the start of 2005, and could probably rise into January 2007 before falling into 2012 and the start of a new major bull market. As for why any of this should occur, you'll have to forecast your own conclusions. The end of terrorism? The discovery of a new energy source? Who can tell? After all, ours is not to reason why, ours is to do or die. Or to put it plainly, "It is difficult to forecast... especially the future." In the meantime, Kondratieff's wave cycles might give you a glimpse of markets to come.
Jacob Singer has been a technical analyst since 1969. He was a futures and options trader with First Financial Futures in Johannesburg for three years, then a technician for stockbrokers Irish Menell Rosenberg specializing in gold and gold shares. He was the editor of South African tipping sheet Temkin and Moon till 1992, when he emigrated to Canada. He uses a mutual fund investment strategy for client portfolios called MOM Investing. SUGGESTED READING
Current and past articles from Working Money, The Investors' Magazine, can be found at Working-Money.com. |
Has been a Technical analyst since 1969 and was a member of the Market Technicians Association of America. Worked as a Futures and Options Trader with First Financial Futures in Johannesburg, South Africa for three years, then for Irish Menell Rosenberg, stock brokers in their research department as a Technician specializing in Gold and Gold shares. He was the Editor of a popular South African tipping sheet, Temkin and Moon, till 1992, and emigrated to Canada qualifying as an Investment advisor. Jack has developed and uses a very successful Mutual Fund investment strategy for client portfolios, called MOM Investing. The strategy is available on a weekly updated web page, restricted to clients only.
| Company: | Global Securities Corporation |
| Address: | Three Bentall Centre, 595 Burrard Street |
| Vancouver, BC V7X 1C4 | |
| Phone # for sales: | 604 443 5473 |
| Fax: | 604 689 5401 |
| Website: | regpub.homestead.com/index.html |
| E-mail address: | jsinger@globalsec.com |
Traders' Resource Links | |
PRINT THIS ARTICLE

|

Request Information From Our Sponsors
- StockCharts.com, Inc.
- Candle Patterns
- Candlestick Charting Explained
- Intermarket Technical Analysis
- John Murphy on Chart Analysis
- John Murphy's Chart Pattern Recognition
- John Murphy's Market Message
- MurphyExplainsMarketAnalysis-Intermarket Analysis
- MurphyExplainsMarketAnalysis-Visual Analysis
- StockCharts.com
- Technical Analysis of the Financial Markets
- The Visual Investor
- VectorVest, Inc.
- Executive Premier Workshop
- One-Day Options Course
- OptionsPro
- Retirement Income Workshop
- Sure-Fire Trading Systems (VectorVest, Inc.)
- Trading as a Business Workshop
- VectorVest 7 EOD
- VectorVest 7 RealTime/IntraDay
- VectorVest AutoTester
- VectorVest Educational Services
- VectorVest OnLine
- VectorVest Options Analyzer
- VectorVest ProGraphics v6.0
- VectorVest ProTrader 7
- VectorVest RealTime Derby Tool
- VectorVest Simulator
- VectorVest Variator
- VectorVest Watchdog

