

HOT TOPICS LIST
- Strategies
- Stocks
- Buy
- Investing
- Brokers
- Psychology
- Interviews
- Accumulate
- Sell
- Hold
- Spotlight
- Websites
- Candlestick Corner
- Gold & Metals
- Options Trading
LIST OF TOPICS
INVESTING
Should You Trade With Technical Indicators?
01/26/01 12:13:12 PM PSTby Julie R. Dahlquist, Ph.D.
Is technical analysis for you? It depends on your approach to the market.
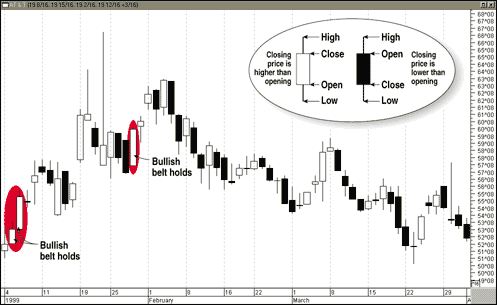
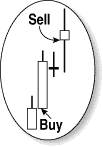
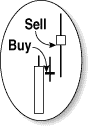
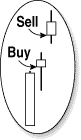
| Are you intrigued by technical analysis but leery of trying it out? If so, you are not alone. Many investors are under the impression that technical analysis is only for those aggressive souls who thrive on trading frequently, not for conservative, buy-and-hold investors. That may be true; it all depends on your personal investing style and what you're going for. Consider Ted, who is a technical analyst who relies on chart patterns to identify buy and sell signals. He sits at his desk buried in candlestick charts, looking for one pattern -- the belt hold?. This candlestick formation consists of a long white body with a small wick on top (bullish) or a long black body with a small wick at its base (bearish). When a bullish belt hold appears on the candlestick charts, Ted yells, "Time to buy!" He enters an order to buy when the market opens the next trading day. Ted is a pure technician. He's not concerned with fundamental economic forces such as supply and demand because he believes price charts already reflect that information. Thus, his decision to buy may come before he even knows the name of the company whose stock chart he is studying. Not only that, Ted won't own the stock for long. He'll sell the stock the day the buy signal disappears. Compare Ted's technique with that of another analyst, Kate. Before making any buy or sell recommendations, Kate analyzes the fundamentals of a company. She examines price/earnings ratios, earnings estimates, and sales growth. She also studies the industry in which the company operates. Only after having a thorough knowledge about a company and its prospects in the industry will Kate consider buying a stock. Her philosophy is to find a good, strong company that is poised for growth, buy the company's stock, and hold on to it. Kate's approach appears to be more cautious and conservative than Ted's. But is it more effective? TECHNICAL ANALYSIS To demonstrate how technical indicators work, let's examine how Ted uses an indicator to determine when to buy a stock. In particular, we will look at how Ted might have used the belt hold pattern to generate buy signals in AT&T for the first quarter of 1999. Figure 1 shows a daily candlestick chart for AT&T. Remember that four prices are used to chart a candlestick for each trading day: the open, high, low, and close. Consider the first candlestick on January 4, 1999 (Figure 1). AT&T opened at $51.52 a share and closed at $51.94. The body of the candle is formed between the opening and closing prices. This is a white- or open-bodied candle, because the closing price is higher than the opening price. The thin lines on either end extend to the high and low prices, which are $53.28 and $51.02, respectively. Thus, the wick of the candle, top and bottom, illustrates the day's trading range for AT&T.
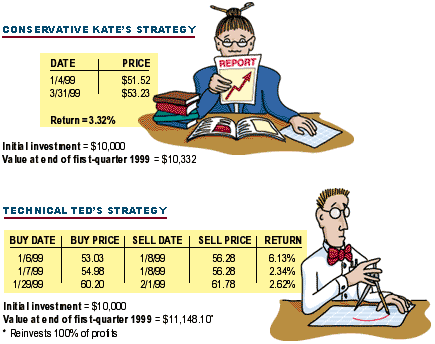
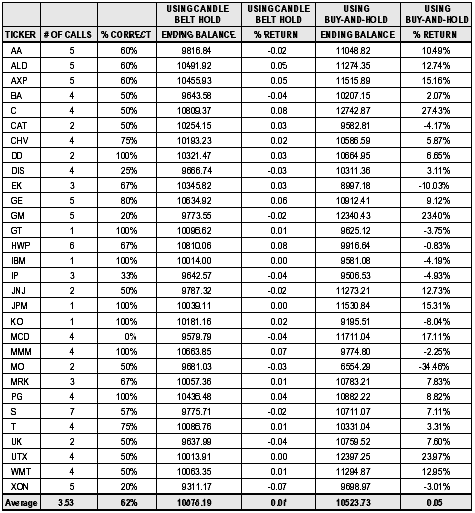
Let's assume that whenever Ted sees a bullish belt hold, he buys the stock at the opening price (the price of the stock when the market opens) on the following day. If by the end of that day a bullish belt hold candle does not occur, Ted will sell the stock when the market opens on the day after. Thus, on any particular day Ted can either own stock or have his money in cash. Using our example of first-quarter 1999, Ted would get a buy signal on three days: January 5 (Figure 2), 6 (Figure 3), and 28 (Figure 4). Thus, Ted would buy the stock on only three trading days of the quarter: January 6, 7, and 29. FUNDAMENTAL ANALYSIS After analyzing the financial statements of AT&T and studying the overall industry, let's say Kate decides that AT&T is a good company in which to invest. So on the first trading day of the quarter, January 4, 1999, Kate purchases stock in AT&T. Following her fundamental strategy of locating financially sound companies whose stocks she thinks are good buy-and-hold candidates, Kate makes no further trades in AT&T during the first quarter. COMPARING THE TWO Still using AT&T as the example, let's take a look at the bottom line -- returns. Technical analysis is a disciplined approach to buying and selling stocks. You need to monitor your indicators on a daily basis. If that buy signal disappears, you need to sell your positions promptly, not think about it for a while. In this example, the belt hold indicator triggered a buy signal on three days in first-quarter 1999. On these days Ted's trades generated a profit, meaning that he had a 100% success rate. This is extremely rare; the typical success rate is about 60-70%. Kate, on the other hand, made only one buy on the first trading day of the quarter and did not have to monitor it constantly. Which is a more advantageous approach? That depends on how you look at it. There are 61 trading days in the first quarter. Of those 61 days, 25 showed positive price movement, 34 showed negative, and two showed no movement at all. This resulted in a 41% hit rate for Kate, which is significantly lower than Ted's 100% rate. Looking at these numbers alone would lead the casual investor to follow Ted's strategy. But look deeper. Even though the percentage of positive days may be higher using Ted's strategy, does this mean his strategy makes more money? Assume both Ted and Kate began the quarter with $10,000 to invest. What would be the value of their initial investment at the end of the quarter (March 31, 1999)? The results can be seen in Figure 5. These returns are calculated without taking commissions or other costs into account.
FIGURE 5 Using her strategy of buy and hold, Kate invests her $10,000 in AT&T on the first trading day of the quarter. By the end of the quarter, these shares will be worth $10,332. In contrast, Ted buys shares in AT&T the first day he gets a buy signal. His first buy is on January 6, 1999. The proceeds he receives when he sells these shares will be used to repurchase AT&T stock when he gets his next buy signal. At the end of the quarter, Ted will have $11,148. Even if you factored in transaction costs of, say, $15 per trade, he would still come out ahead of Kate. Is Ted's strategy less conservative than Kate's? On the surface it may appear so, but keep in mind that the daily returns of Ted's investment strategy are less volatile than those of Kate's strategy. Since Kate has her money in for the long term, she must withstand periods of negative returns in hopes that her patience will pay off down the road. Another factor to keep in mind is that Ted has his capital in the market less often, and, therefore, faces less market risk. This scenario paints a picture of a major difference between fundamental and technical analysis. Ted must wait for a day in which he is fairly certain that AT&T will be a good buy. But waiting for that good buy means having to have tremendous patience, particularly since, if you recall, Ted is a chartist; he didn't do the background research on his stock choice that Kate did, and thus may know little about it. Ho-hum days are the norm for the technician, and days for extraordinary returns are exceedingly rare. Nevertheless, these short-term returns can add up to significant returns since you avoid the negative return days. Of course, this example is based on using one technical indicator, for one stock, over three months, which is clearly not enough to make a comparison between a long- and short-term investment. To make a more substantive conclusion, I conducted additional research using the same period -- the first quarter of 1999 -- and the 30 stocks that made up the Dow Jones Industrial Average (DJIA) at that point (it has changed since that time). I compared returns using the bullish belt hold strategy with a buy-and-hold strategy. The results (see sidebar, "Belt hold scenario") suggest that the technical trader will be in the market less often than the buy-and-hold investor. By being in the market less often, the technical trader avoids market fluctuations. IN THE LONG TERM Are these results typical for the long term? To find out, I documented a consistent, conservative strategy using technical indicators. I studied 878 different stocks over 12 years and found that in this broad sample, stocks had a positive return on 45.6% of the trading days. When I tested 60 of the most commonly used technical indicators, I found they generated buy signals on only 27.9% of the trading days, but the average daily return on the days when buy signals occurred was 0.064%, compared with an average daily return of 0.055% for all test period days. This suggests that technical indicators are good at signaling above-average positive return days. However, an investor who follows these indicators strictly will miss out on the return associated with positive but low-return days. Over time, the opportunity costs of not being invested in stocks on these positive, low-return days can add up to forgoing large profits. CONCLUSION Technical analysis and buy-and-hold both have their strengths and weaknesses. Using technical analysis can help investors avoid large losses. Using technical analysis, small-profit and small-loss days will on average cancel each other out, leaving the investor with occasional large profits without large drawdowns. Research suggests that technical analysis steers the investor away from small profits, unchanged positions, small losses, and large losses, and instead channels the trader toward large-profit days but not small-profit days. Buy-and-hold, on the other hand, requires far less monitoring, though the volatility in the market, with all of its ups and downs, will be reflected in the buy-and-hold investor's portfolio. In the end, what does all this mean for Ted and Kate? Examining the results in Figure 5, we can conclude that for the example we used, Ted's technical strategy edged out Kate's buy-and-hold method. In addition, the technical analyst has less volatility in his portfolio but lower cumulative returns as well than the fundamental analyst who follows a buy-and-hold-strategy (see sidebar). The fundamental analyst, on the other hand, has the advantage of not having to monitor her stocks constantly, depending instead on her long-term investment in her stocks to make her profits. What does it all comes down to? It's just a matter of investing style. BEST HOLD SCENARIO
For more information about candlestick formations, see the Quick Reference Chart in the January/February 2001 issue of Working Money. REFERENCES AND RESOURCES | ||||||
| Title: | Associate professor of finance |
| Company: | St. Mary's University in San Antonio, TX |
| Address: | St. Mary's University |
| San Antonio, TX | |
Traders' Resource Links | |
PRINT THIS ARTICLE

Request Information From Our Sponsors
- VectorVest, Inc.
- Executive Premier Workshop
- One-Day Options Course
- OptionsPro
- Retirement Income Workshop
- Sure-Fire Trading Systems (VectorVest, Inc.)
- Trading as a Business Workshop
- VectorVest 7 EOD
- VectorVest 7 RealTime/IntraDay
- VectorVest AutoTester
- VectorVest Educational Services
- VectorVest OnLine
- VectorVest Options Analyzer
- VectorVest ProGraphics v6.0
- VectorVest ProTrader 7
- VectorVest RealTime Derby Tool
- VectorVest Simulator
- VectorVest Variator
- VectorVest Watchdog
- StockCharts.com, Inc.
- Candle Patterns
- Candlestick Charting Explained
- Intermarket Technical Analysis
- John Murphy on Chart Analysis
- John Murphy's Chart Pattern Recognition
- John Murphy's Market Message
- MurphyExplainsMarketAnalysis-Intermarket Analysis
- MurphyExplainsMarketAnalysis-Visual Analysis
- StockCharts.com
- Technical Analysis of the Financial Markets
- The Visual Investor