

HOT TOPICS LIST
- Strategies
- Stocks
- Buy
- Investing
- Brokers
- Psychology
- Interviews
- Accumulate
- Sell
- Hold
- Spotlight
- Websites
- Candlestick Corner
- Gold & Metals
- Options Trading
LIST OF TOPICS
TRADER'S NOTEBOOK
A Fundamental Lesson For The Technically Minded
04/29/13 02:39:33 PM PSTby Matt Blackman
For decades, there have been two major schools of thought when it comes to stocks. First came the fundamentalists who believe that stock prices are a product of revenues and earnings. Then came the technicians who believe that all they need to know is contained in the stock charts. Here, we look at how the two methodologies come together.
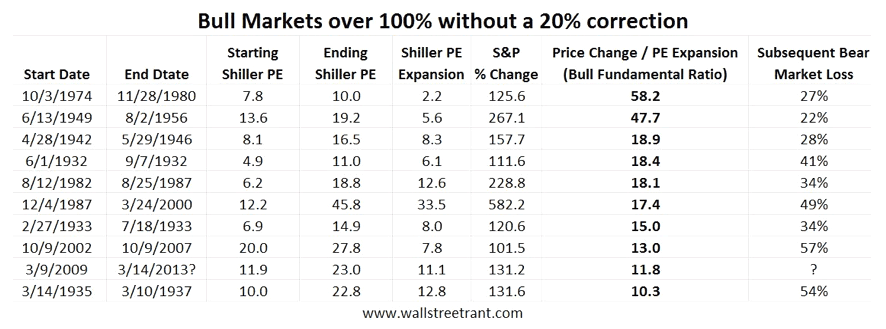
| Like many investors, when I began to play the markets, I believed that if you found companies with strong balance sheets, a good product, and a strong management team, you would make money. But one challenge quickly became evident: Earnings lagged stock prices most of the time. When the economy slowed down, earnings often gave little or no warning before stock prices fell. Relying on balance sheets to determine trade entries and exits tended to get you in well after the move was over, and out too late to avoid the pain. DO FUNDAMENTALS REALLY MATTER? But do they? To explore this question in detail, I used the cyclically adjusted price/earnings (P/E) ratio data from Robert Shiller's website. He separated out bull markets that experienced at least 100% gains without a 20% correction between 1930 and the present and then ordered these markets from the most strongly earnings-driven to the weakest using the ratio of price gains divided by the expansion in the P/E multiples. Bulls showing the smallest P/E expansions (that is, those that enjoyed the greatest earnings growth) were considered the most fundamentally driven. His results are shown in the table in Figure 1.
FIGURE 1: BULL MARKET RANKINGS BASED ON STOCK PRICE CHANGE DIVIDED BY P/E EXPANSION. Bull markets with the highest bull fundamental ratios were considered fundamentally stronger, since stock price increases were accompanied by comparable earnings growth versus markets in which the stock prices greatly exceeded earnings growth. |
| As you can see in Figure 1, bull markets in which earnings growth was more closely aligned with price growth suffered smaller subsequent corrections. In other words, rallies accompanied by the greatest earnings growth held up better in corrections than those where investors bid stock prices up higher than earnings would otherwise dictate. Compare the 1974-80 bull with the one from 2002-07. The first experienced a P/E expansion of 2.2 versus an expansion of 7.8 for the second. In the ensuing corrections, the 1981 recession saw stock prices fall by 27% compared to a drop of more than double (57%) from 2007-09. CHARTING THE RESULTS
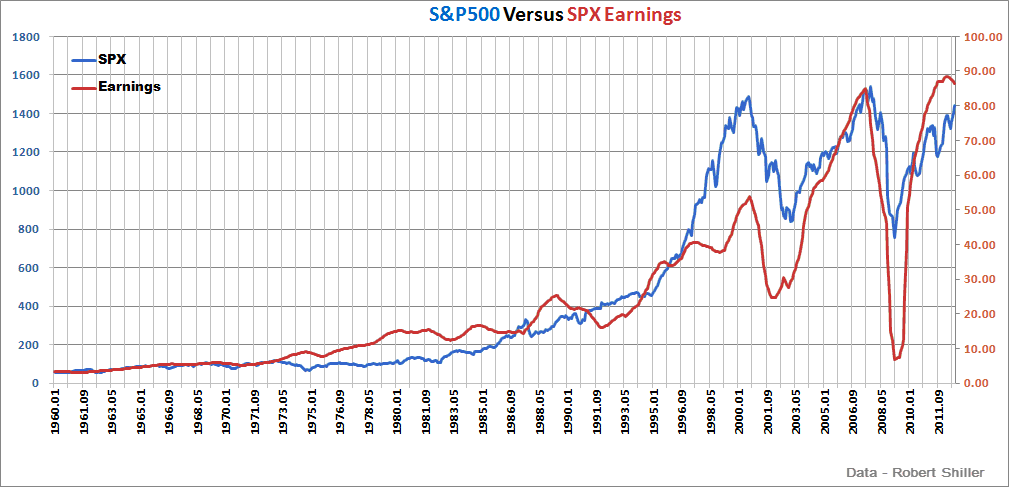
FIGURE 2: MONTHLY DATA OF THE S&P 500 INDEX (LEFT-HAND SIDE) VERSUS SPX EARNINGS (RIGHT-HAND SIDE). At the end of the 2001-02 recession and end of the 2003-07 bull market, earnings led. At other times, such as the peak in 2001 and bear market trough in 2003, earnings moved with stock price. |
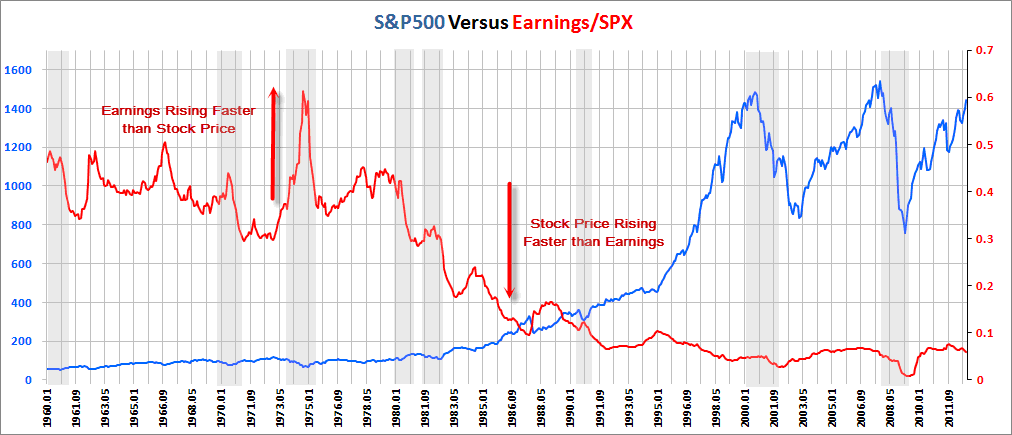
| To examine the relationship more closely, I next compared the relative strength of S&P 500 earnings to the S&P 500 index (Figure 3). As the chart shows, earnings outperformed price more frequently from 1960-80 than later, when earnings experienced a "bear market," consistently falling relative to price.
FIGURE 3: MONTHLY DATA FOR THE S&P 500 INDEX WITH THE RELATIVE STRENGTH OF SPX EARNINGS (EARNINGS DIVIDED BY THE SPX). Earnings outperformed stock price more frequently from 1960-80 than later when earnings experienced a "bear market," consistently falling relative to price. Recessions are shown by the gray vertical bars. During the 1982-2000 bull market, investors were more optimistic about the future of stocks -- earnings appeared to matter less. Earnings grew relative to stock prices during the 1987 bear market and more modestly from 1992-95. But other than brief periods in 2001-02 and 2008-09, stock prices appreciated well ahead of earnings for most of this period. But this euphoria came at a cost. What is evident from Figure 3 is that the "irrational exuberance" in the 1990s caused stock prices to rise more quickly than earnings, an emotion for which investors paid in 2001-02 with a correction of nearly 50%. Evidence suggests that investors did not appear to have learned their lesson in the 2003-07 bull market. It was associated with an even greater disconnect in which stock prices were bid up well above earnings followed by an even more severe bear market drop. What should concern traders and investors is that the 2009 bull market has so far demonstrated weaker fundamental growth, as evidenced by P/E expansion of 11.1 (thus far). If the data in Figure 1 proves a reliable guide, this puts us on track for a 50%+ correction when the euphoria finally subsides. This view is further substantiated by the 1935-37 bull, which experienced levels of government stimulus similar to what we have had recently. Stock prices in the late 1930s were pushed up to unsustainable levels and a very painful correction in excess of 50% followed. |
| LESSONS LEARNED...OR NOT There are a number of lessons to be learned from this exercise. First, it takes far less earnings ($0.06) to "buy" a one-point gain on the S&P 500 today than it did in the 1970s, when each one-point gain in SPX required $0.40-0.60 in earnings. Some might argue that this gain is due to inflation, but why would stock prices be more prone to inflation than earnings? How much of a factor were the unlimited series of quantitative easing programs in pumping stock prices to new highs over the last decade? How long can this trend continue before the next fundamental "reversion to the mean" reckoning day? Earnings/SPX relative strength (red line in Figure 3) appears to be at, or at least near, some sort of bottom. It can't go any lower than zero. A second lesson is that fundamentals appear to be less important over the short term. Stock prices often move higher due to investor enthusiasm and hope than due to relative earnings -- and this trend has been going on for decades. But perhaps the biggest lesson of all is that although it may be possible to ignore earnings fundamentals for months or even years, the more out of whack stock prices become relative to earnings, the more painful and protracted the aftermath. And this is a lesson that investors all too quickly tend to forget. SUGGESTED READING
|
Matt Blackman is a full-time technical and financial writer and trader. He produces corporate and financial newsletters, and assists clients in getting published in the mainstream media. He tweets about stocks he is watching at www.twitter.com/RatioTrade Matt has earned the Chartered Market Technician (CMT) designation.
| E-mail address: | indextradermb@gmail.com |
PRINT THIS ARTICLE

Request Information From Our Sponsors
- VectorVest, Inc.
- Executive Premier Workshop
- One-Day Options Course
- OptionsPro
- Retirement Income Workshop
- Sure-Fire Trading Systems (VectorVest, Inc.)
- Trading as a Business Workshop
- VectorVest 7 EOD
- VectorVest 7 RealTime/IntraDay
- VectorVest AutoTester
- VectorVest Educational Services
- VectorVest OnLine
- VectorVest Options Analyzer
- VectorVest ProGraphics v6.0
- VectorVest ProTrader 7
- VectorVest RealTime Derby Tool
- VectorVest Simulator
- VectorVest Variator
- VectorVest Watchdog
- StockCharts.com, Inc.
- Candle Patterns
- Candlestick Charting Explained
- Intermarket Technical Analysis
- John Murphy on Chart Analysis
- John Murphy's Chart Pattern Recognition
- John Murphy's Market Message
- MurphyExplainsMarketAnalysis-Intermarket Analysis
- MurphyExplainsMarketAnalysis-Visual Analysis
- StockCharts.com
- Technical Analysis of the Financial Markets
- The Visual Investor