HOT TOPICS LIST
- Strategies
- Stocks
- Buy
- Investing
- Brokers
- Psychology
- Interviews
- Accumulate
- Sell
- Hold
- Spotlight
- Websites
- Candlestick Corner
- Gold & Metals
- Options Trading
LIST OF TOPICS
TRADER'S NOTEBOOK
10 Signs That Tell You When To Stop Trading
11/09/11 01:57:57 PM PSTby Matt Blackman
Everybody is hunting for the best buy signals, but this focus ignores a major trading reality: You don't earn a penny until you sell. And you won't keep it if you don't know when to sit on your hands.
| Making money in the markets is a 10/90 proposition - 10% buying and 90% selling, according to trader Larry Williams. But take a look at any trading system or service out there and you'll find they have one thing in common - generating buy signals. When exit signals are mentioned, it's almost as an after-thought to the main message. Educators and systems developers will tell you that the sizzle comes from getting into the trade, leaving students to learn about money management strategies, including when and how to exit on their own. It is the same old story when it comes to staying out of the market. How many trading books have you read or seen advertised that teach you when to sit on the sidelines than be invested? Not many! Why not? It's simple. Exit strategies, money management, and stepping aside simply aren't sexy. Meanwhile, traders are happy to spend a bundle to get the latest buy signal, even though they don't put a penny in their pockets until they've sold. And it's easy to lose it all by trading an ugly market. With these realities in mind, I thought it was high time to examine signs used by a well-known trader to see what he looks for when he's exiting trades and what keeps him out of the market altogether. These are lessons that Dan Zanger, host of ChartPattern.com, had to learn the hard way. It was an expensive lesson but one that he says is necessary for all traders need to learn if they want to be successful. And what he learned stood him in good stead in 2011. SUMMER OF OUR DISCONTENT Another of his past market leaders, the ProShares Ultra Silver exchange traded fund (ETF) (AGQ), had been cut in half since its late April peak, which was another reason for concern. On his DanZanger Twitter feed, he offered his take, commenting that "no need to trade all the time...sitting in almost all-cash - new buys will be built from this action." |
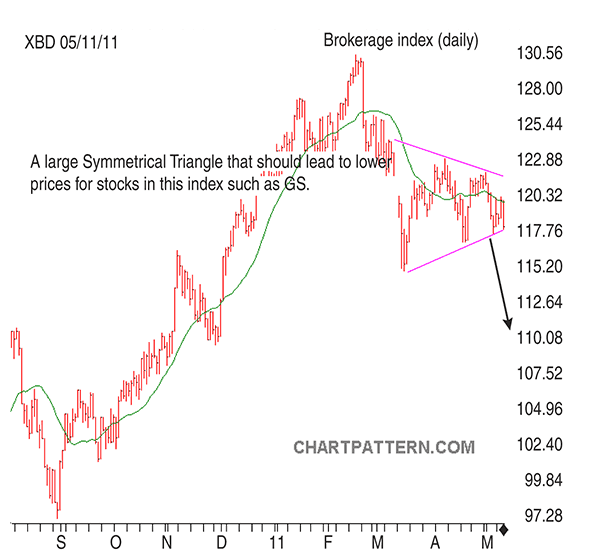
| A week later, he noted that the neckline of the bullish inverse head & shoulders pattern on the SPX had been breached, which was another good reason to become more defensive: "It's situations like this that tempt dip-buyers to get back into the market and that can be very costly before you get the right confirmation." On May 11, there was another warning. The AMEX Securities Broker/Dealer Index (XBD) showed a pattern that spelled lower prices ahead. And on May 13 alone, it dropped nearly 5% and continued to fall (Figure 1).
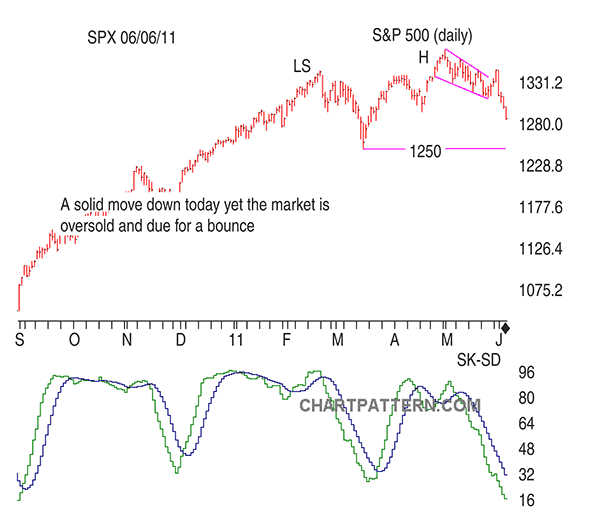
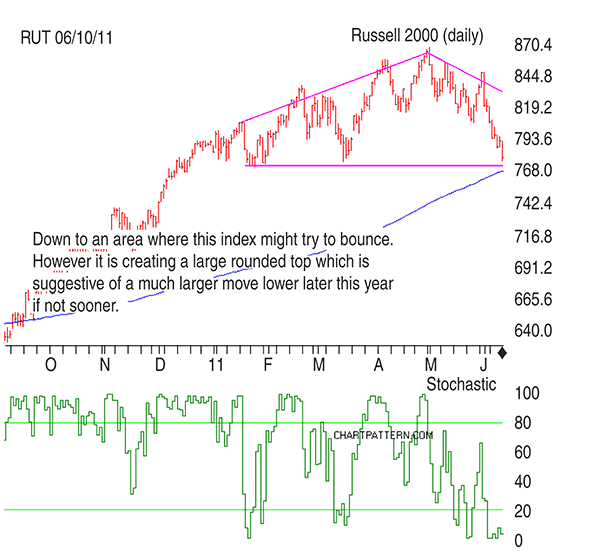
FIGURE 1: DAILY AMEX SECURITIES BROKER-DEALER INDEX SHOWING CLEAR BEARISH SYMMETRICAL PATTERN. COURTESY CHARTPATTERN.COM In early June, Zanger discussed a bearish head & shoulders pattern that was near completion on the SPX in his newsletter (Figure 2). This pattern together with the one on the Russell 2000 (Figure 3) showed a market on the edge. This rounding top forming on the Russell 2000 index that he warned of in his June 10th newsletter was significant, since this index had a habit of leading larger-cap indexes in both rallies and corrections.
FIGURE 2: BEGINNINGS OF BEARISH HEAD & SHOULDERS PATTERN THAT BEGAN TO EMERGE ON S&P 500
FIGURE 3: DAILY CHART SHOWING ALMOST-COMPLETED BEARISH ROUNDING-TOP PATTERN JUNE 10 |
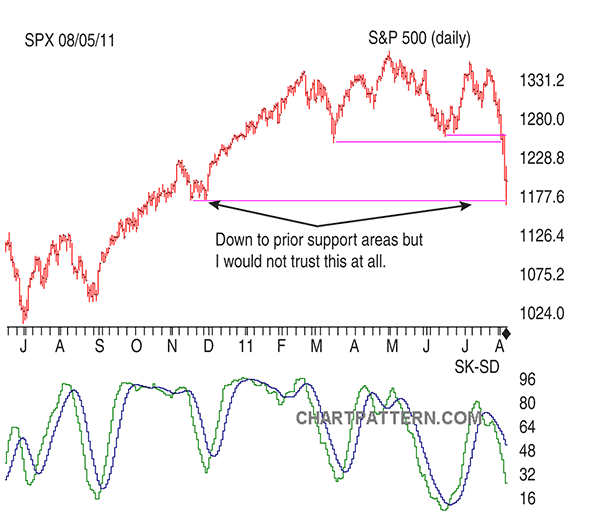
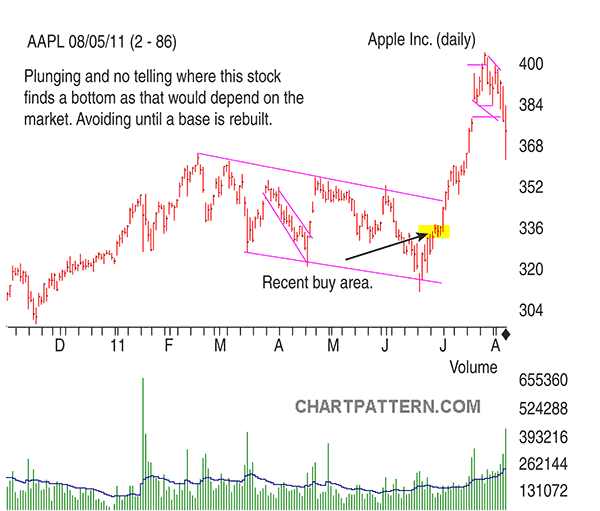
| Stocks dropped across the board into the middle of June then started to stage a comeback. But it was a bear market rally. On June 24, the SPX moved back up to fill the gap from the day before and then sold off. And there were other signs of trouble. On June 27, Zanger discussed the bear channel forming in the SPX that implies lower prices. This was further confirmation of the large topping pattern in the Russell 2000 index. But there was still money to be made by those who were quick on the draw and didn't overstay their welcome. However, the risks of playing the game had greatly increased. When the SPX put in a lower high on July 7, worry was growing that US politicians would fail to reach an agreement on the debt ceiling as the August 2nd deadline grew near. Even though the major indexes were falling, some market leaders like AMZN and AAPL continued to rise until the end of the month. But then everything began to drop, causing Zanger to get more defensive. By July 28, he was back to mostly cash, a position he maintained for the most part until the second week of October. |
| Here is a summary of the 10 signs that Zanger uses to measure reversal risk. He's not a big fan of shorting stocks; he believes going short in a bear market is a risky business, especially near the beginning of the correction, because any good news can propel stocks temporarily much higher, which can be costly to those on the wrong side of the trade. Like the use of margin, selling short is only for the very experienced with an account that can withstand a powerful bear rally. TEN SIGNS THAT TELL YOU IT'S TIME TO EXIT
SUGGESTED READING
|
Matt Blackman is a full-time technical and financial writer and trader. He produces corporate and financial newsletters, and assists clients in getting published in the mainstream media. He tweets about stocks he is watching at www.twitter.com/RatioTrade Matt has earned the Chartered Market Technician (CMT) designation.
| E-mail address: | indextradermb@gmail.com |
PRINT THIS ARTICLE

|

Request Information From Our Sponsors
- StockCharts.com, Inc.
- Candle Patterns
- Candlestick Charting Explained
- Intermarket Technical Analysis
- John Murphy on Chart Analysis
- John Murphy's Chart Pattern Recognition
- John Murphy's Market Message
- MurphyExplainsMarketAnalysis-Intermarket Analysis
- MurphyExplainsMarketAnalysis-Visual Analysis
- StockCharts.com
- Technical Analysis of the Financial Markets
- The Visual Investor
- VectorVest, Inc.
- Executive Premier Workshop
- One-Day Options Course
- OptionsPro
- Retirement Income Workshop
- Sure-Fire Trading Systems (VectorVest, Inc.)
- Trading as a Business Workshop
- VectorVest 7 EOD
- VectorVest 7 RealTime/IntraDay
- VectorVest AutoTester
- VectorVest Educational Services
- VectorVest OnLine
- VectorVest Options Analyzer
- VectorVest ProGraphics v6.0
- VectorVest ProTrader 7
- VectorVest RealTime Derby Tool
- VectorVest Simulator
- VectorVest Variator
- VectorVest Watchdog

